Essential Steps to Ensure only Valid Flow Meter Data are Used in Sewer Assessments
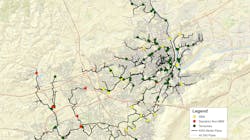
Collecting accurate flow meter data is important, especially in regard to storm sewers. To ensure that valid data is collected, there are certain steps project teams should take. Recently, Arcadis and Flow Assessment Services (FAS) took these steps to validate 116 flow meters in Lehigh County, Pa., for the Lehigh County Authority (LCA). LCA has a sanitary sewer system, but these steps can be applied to any flow monitor-ing project, including storm sewer and combined sewer.
There are five essential steps to ensure flow meter data validity. The essential steps are basin characteristics, meter site selection and install, scattergraph review, hydrograph review, and flow balance. If these steps are not followed, there is a significant risk of the flow meter data being incorrect, which can result in incorrect conclusions and design decisions.
QAQC Overview
Understanding Basin CharacteristicsWhen picking a metering site, keep in mind the program’s goals and the drain- age basin’s flow characteristics. The area needs to be small enough to pick up unique characteristics of the area, while also large enough that the meter willbe able to pick up the flow depth and velocity. If the goal is to calculate the infiltration and inflow (I/I) pre and post rehabilitation, then the rehabilitated area and unrehabilitated control area each need to have their own flow meter. The sewer system’s maintenance team will have the best insight into which areas are problematic and should be monitored, and which areas may be difficult to meter.
Metering Site SelectionThe physical characteristics of the meter- ing site influence the flow data quality. For optimal set-up, the incoming and outgoing pipes should be straight, have laminar flow, and no hydraulic jumps. Area-Velocity (AV) meters and Parshall and Palmer-Bowlus flumes were used on this project. For AV meters, the velocity should consistently be between one and six feet per second and the depth at least one inch. If outside these values, the AV sensors’ inaccuracy increases dramatically. For areas with lower depths and velocities and no backwater, aMeter Install and Site Review. It is important to have an experienced meter installation team that completes frequent in-person meter checks. For high stakes programs like this one, independent installation and flow meter calibration in-person checks should be completed to ensure that the site set-up and meter readings are mutually agreed upon. If there are discrepancies, then the meter should either be recalibrated, replaced with same meter type, replaced with a flume and sensor, or the entire meter was relocated. The FAS meter team performed bi-weekly check-ups on every single meter during the entire monitoring period.
Multiple QAQC rounds. The monitoring period was eight months in total, consist- ing of four two-month quality checking rounds. This duration provided multiple dry periods and rain events to evaluate the meters’ performance. It also allowed identification of long-term shifts in the flow data that may or may not be real. The figure below shows a township’s flow meter that had a 200 percent increasein flow over the monitoring period. This change in flow was unrelated to rain or water usage and deemed inaccurate. If a shorter monitoring period had been used, this meters’ inaccuracies may not have been caught.
ScattergraphThe meter’s scattergraph depicts what flow conditions are occurring in the metered pipe segment. In ideal circum- stances, the pipe will be under free flow conditions with a strong relationship between depth and velocity. The flow data is more likely to be accurate under these ideal conditions. Scattergraphs are excellent tools for identifying sensor malfunctions, sediment build-up around the sensor, surcharge and overflow conditions near the meter, and depth and velocity boundary conditions affecting data quality.
Additional Scenarios
HydrographLike scattergraphs, hydrographs help explain the flow characteristics of themetered segment and validate the data. The following sections explain key components to review in the hydrographs.Rain Response. Looking at how the meter responds to rain events is a critical step in the review process. If there is an immediate spike in flow, then that meter experiences inflow. If the flows stay elevated for days after the rain event, then that meter experiences infiltration. Make sure that the hydrograph data matches what is known about the system. Areas where the I/I sources have been rehabilitated should expect less of a rain response than before the rehabilitation.
Flow Balance. When meters are put in series with one meter upstream of another, make sure the upstream meter always reads a logical, expected volume lower than the downstream meter. In the figure below, the upstream meter (black) is consistently lower than the downstream meter (red) during dry weather. During rain events, however, the upstream meter’s flow shoots up higher than the downstream meter, then drops out. This is an indication that something is wrong with the upstream meter during rain events and that data is unusable.
Quantitative AnalysisThe last check is to look at the average daily dry day flow for that specific meter and divide it by the equivalent dwelling units (EDUs) in the basin. This step is for combined sewer or sanitary sewer only. For residential basins, the EDU count is equal to the parcel count, but for basins with higher discharges per parcel, such as an industry, the EDU count can be adjusted to account for these higher flows. The average daily dry day flow is then divided by the EDU count to get the average daily flow per EDU. The typical range is 175 to 300 gallons per day (GPD) per EDU. If the value is out of this range, then the meter should be evaluated further to make sure that there is a legitimate cause, and that the data is not recording incorrectly. A high value could indicate inaccurate data or that the meter basin has high groundwater infiltration. A low value could be caused by a watertight basin with little infiltration or an area with many part-time residences. Discerning between meter inaccuracy and actual flows is the goal of this QAQC step, and often takes careful consideration of all the data, especially across multiple months of flow data. The GPD per EDU should be consistent through- out the monitoring period or at least have a rational explanation for why it is going up or down.
Alexandria King | Professional Engineer
Alexandria King is a Professional Engineer at Arcadis in Philadelphia. She is a graduate of Cornell University in Environmental Engineering. Her areas of experience include hydraulic and hydrologic modeling, buried infrastructure assessment and rehabilitation, flow management, construction oversight, and stormwater program development. Questions can be sent to [email protected].


