Streamflow data are the most valuable asset for understanding the hydrological cycle and for managing water resources. Distributed inputs, diverse storage elements, and vital uses for water exist for every watershed. Fortunately, a unique point of outflow can usually be found to integrate all of this internal complexity into an information-rich signal of water resource availability and variability.
But not all hydrometric data are created equal. While hydrographers always seek to produce the best streamflow data, factors beyond their control can affect quality across data sets. Data quality varies from gauge to gauge and from time to time. Understanding this variation is essential for the development of effective monitoring plans. Rigorous characterization of this variation demonstrates a commitment to quality management.
Communicating quality variation is critically important for the interpretation and analysis of the data. Data grading is a method of allocating a measure of data quality according to a prescribed classification system. Time and effort invested in data grading improves the value and usability of the entire dataset.
For some purposes it is important to have a complete dataset (e.g., for water balance calculations) even though some data points may have intrinsically lower quality. Differences in data quality become more important when they are used for hypothesis testing (e.g., is there a trend?); calibration (e.g., are model residuals correlated with data quality?); water resource management (e.g., does the evidence justify an intervention?); and emergency response (e.g., initiate immediate action or wait for confirmation?).
High-impact decisions deserve careful attention to the truthfulness of the information influencing the decision. High-impact decisions are often informed by data that represent unusual conditions and/or lack independent corroboration. It is often relatively straightforward to collect high-quality data for the “normal” condition, and it can be difficult to collect high-quality data for the “extraordinary” condition. Extremes occur infrequently and inconveniently (e.g., during storms in the middle of the night). Extraordinary conditions are typically adverse and sometimes beyond the validity of measurement assumptions (e.g., steady flow, uniform velocity distribution). Thus, the relatively high uncertainty resulting from unique conditions is often propagated to the most important values in the dataset.
Making the right water resource decisions requires data that are fit for purpose. Good outcomes can arise from poor-quality data when that quality is properly accounted for in decision making. Inefficient or ineffective results can arise from good-quality data if the quality is unspecified and therefore assumed to be poor. All data, regardless of quality, become more valuable when quality is understood, characterized, and shared.
The Emerging Problem
In the 21st century, the responsibility for hydrometric monitoring is increasingly being devolved to local levels of ownership, with a wide variety of data providers operating to a wide range of standards. Even the range of products now available from national hydrometric programs, including real-time data published online, can have a different standard of care than the archives. User trust has been built over decades based on archive-ready products. Yet advances in technology and shrinking budgets have made it increasingly necessary for data consumers to rely on data obtained from the Internet, for which the quality may be uncertain.
As our best source of hydrological information, it has been convenient to assume that streamflow data are substantially free of error. This assumption is widely prevalent despite not being valid as a generalization. Data errors conceal the true nature of watershed-scale processes and propagate through decision-making processes.
Old Situation. Widespread disregard for the specifics of hydrometric data quality can be traced to the trust relationship that data consumers have had with their data providers. In many regions of the world, data production has traditionally been the responsibility of a national hydrometric program transparently operated with a high degree of procedural rigor. Trust in these operational standards was such that a conventional wisdom developed: It has been widely assumed that hydrometric data are accurate to +/- 5% 95% of the time.
New Situation. While the free exchange of water data across monitoring organizations will bring tremendous value to the industry, a data-grading standard is required to ensure informed decisions for the optimal management, allocation, and protection of precious water resources. (See Table 1.)
The Open Geospatial Consortium (OGC) has successfully consolidated six different standards for exchange of water data into the WaterML 2.0 standard. This success is an industry game-changer, allowing for the interoperable exchange of water data sets across agencies and information systems. Information silos are being unlocked. However, communicating the relative quality of data becomes increasingly crucial when data are freely interchangeable.
Online and interagency sharing of hydrometric data requires a systematic approach for all aspects of metadata to enable search, discovery, and access. Finding out whether data exist is the first part of the problem. The second part is discovering whether the data are fit for use.
The quality of data is a function of many factors and influences that are known to the hydrographer producing the data. It is this quality that must be represented with the data to optimize its value and usability across agencies.
The principle of prudent wariness (i.e., caveat emptor) should be adopted by all hydrometric data consumers.
Data providers need to qualify their data with reliable estimates of data accuracy, and data consumers need to carefully evaluate whether data are fit for their intended purpose. Sharing data quality is key to building trust between stakeholders. A look at the current standards helps determine how to characterize and communicate data quality.
How? The OGC has published WaterML 2.0 codes for communicating data quality. Recognized standard operating procedures (e.g., WMO, ISO, USGS, WSC, and NEMS) can be used to characterize the quality property for this new standard for data sharing.
What? Characterizing data quality requires compliance with recognized industry standards for selecting a site, monitoring water level, and computing discharge to better assess the quality of water data.
Why? Communicating data context and quality instills confidence in the data. This enhanced trust results in faster response to emergencies, improved certainty in the allocation
of water, and more decisive actions for protecting water resources and the environment.
Standards for Communicating Data Context and Quality
An arbitrary measure of data quality, in and of itself, is of limited value for evaluating whether data are suitable for any given analytical purpose. Whitfield (2013) argues that “fit for purpose” data must have intrinsic quality; be considered in the context of the task (i.e., the data are relevant and meaningful for the question at hand); be representative; and, finally, be accessible. This evaluation therefore requires characterization and communication of data quality as well as qualifiers for data source, background conditions, range, method, data processing status, and statistic code.
Lehman and Rillig (2014) propose that data uncertainty is “unexplained variation.” It is considered to be unexplained because it is manifested as signal noise.
Lehman and Rillig (2014) also propose that data context is “explained variation.” Explained variance can be either extrinsic (i.e., due to factors outside of the data production process) or intrinsic (i.e., influenced by the methods used in data production process). Extrinsic variance can be discovered after the fact, whereas intrinsic variance must be transported with the data.
Quality and context are both relevant to the correct interpretation of data. Lehman and Rillig (2014) make a compelling argument that communicating relevant metadata enables variance partitioning and results in greater collective action, policy changes, and effective communication of climate science.
Codes and standards for communicating data quality and context have been published by five different existing organizations: the Open Geospatial Consortium (OGC), World Meteorological Organization (WMO), US Geological Survey (USGS), Water Survey of Canada (WSC), and the National Environmental Monitoring Standards (NEMS).
Data Quality. The most comprehensive options for categorizing data quality are available from the OGC and NEMS. Table 2 presents the data quality categories defined by the five existing standards.
The OGC vocabulary for data quality lists six categories of which only one (Estimate) is common across all agencies. The OGC description of estimate is “The data are an estimate only, not a direct measurement.”
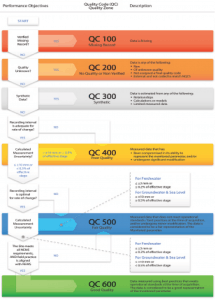
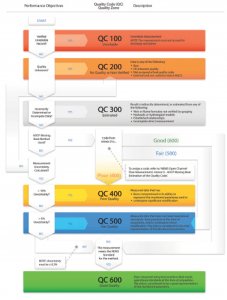
Only one agency, NEMS, has a quality schema that can be mapped to all six OGC categories. The NEMS categories are meant to be interpreted in context of the parameter standard. For instance, QC 300 is defined for flow data: “Result is indirectly determined, or estimated from any of the following: weir or flume formulae not verified by gauging; hydraulic or hydrological models; established relationships; incomplete direct measurement.” QC 300 is also defined for water level data: “Data are estimated from any of the following: Relationships; Calculations or models; limited measured data.”
Data Source. Trust in data depends on the identity of the data provider. The reputation, credibility, and respectability of an agency are based on the rigor of its conformance to trusted standards in the care of its data. Identification of data source per point becomes important when data are combined from multiple data providers (e.g., for infilling). ISO19115 and OGC identify a property of data indicating the data provider.
Background Conditions. Background conditions may apply to an entire dataset (e.g., seasonal monitoring) or on a point-per-point basis (e.g., discharge affected by ice).
OGC has a property that is generalized for qualifying information that is broader in nature than the quality property with no defined vocabulary. WMO, USGS, and WSC identify presence of ice as “I”, “A,” and “B” respectively. USGS identifies backwater conditions as “B.” WSC identifies that there is no water at the gauge as “D.” WMO identifies the presence of snow as “S,” frost as “F,” station submerged as “D,” results from a non-standardized lab as “N,” and results from a partially quality controlled lab as “P.”
Background condition codes mapped to the OGC “qualifier” property need to be interpreted with reference to data source. For example, “B” could be either ice (WSC) or backwater (USGS), and “D” could be either dry (WSC) or station submerged (WMO).
Range. Communicating upper and lower limits supports the interpretation of the data. WMO and USGS identify values greater than calibration or measurement limit as “G” and “>”, respectively; and values less than the detection limit as “L” and “<” respectively. WMO identifies a value outside normally accepted range that has been checked and verified as “V.” OGC has a “censoredReason” property to describe measurements outside of detection limits for which “Above range” and “Below range“ are suggested descriptions.
Method. Method (a.k.a. provenance) refers to the specifics of the monitoring plan that influence data quality including, for example, instruments, observing practice, locations, sampling rates, and data workup procedures. Whitfield (2012) makes the case that changes in observation method, techniques, and technology introduces heterogeneity in time series. Thus improvements made for one purpose impact on the fitness of data for other purposes (e.g., detecting and understanding environmental change).
The Global Climate Observing System (GCOS) recognizes this problem in the core principles for effectively monitoring climate. For example, “The details and history of local conditions, instruments, operating procedures, data processing algorithms and other factors pertinent to interpreting data (i.e., metadata) should be documented and treated with the same care as the data themselves.”
There is currently no guidance on how to communicate method from ISO, WMO, USGS, WSC, or NEMS. The OGC ObservationProcess type provides some aspects of the instrument and related metadata, including a top level categorization of the process types: Simulation, Manual Method, Sensor, Algorithm, and Unknown. OGC SensorML goes a lot deeper, supporting more complex process chains and hardware descriptions.
Data Processing Status. The status of the data process (a.k.a. approval, aging, process quality) refers to the degree of scrutiny the data have encountered in a data review. This is extremely important for tracking the version history of data published online. Initially the data may be in a raw state. The data may be corrected, but still subject to change. The data may be fully scrutinized and deemed to be archive-ready. Finally, a forensic audit (perhaps using evidence unavailable at the time of original data processing) may reveal correctable problems in previously approved data resulting in a revised status.
OGC provides a “processing” property per value with the possibility of providing a default if the time series is largely homogeneous. OGC does not provide a defined vocabulary for processing code.
OGC, WMO, and NEMS currently include the concept of unchecked data as a quality code, rather than breaking the concept out as a data processing status. The USGS identifies daily value approved for publication-processing and review complete as “A” and daily value provisional data subject to revision as “P.” WSC identifies that a revision correction or addition has been made to the historical discharge database after January 1, 1989, as “R.”
Statistic Code. A statistic code is used to identify the time scale and method for time series statistics. There can even be statistics on statistics (e.g., the annual maximum daily flow versus annual maximum instantaneous flow). The statistic code is needed to interpret the data. Is the timestamp an explicit observation (e.g., maximum instantaneous)? Or is it nominal (e.g., annual mean flow)? Is the statistic timestamp at the start, midpoint, or end of the interval? Time series statistics are dependent on time offset (e.g., observations may be acquired and stored at a UTC offset, but daily values computed to an LST offset).
OGC provides an interpolation type that describes the style of the statistic used. Additionally, there is the “aggregationDuration” property within a time series that specifies the temporal period over which aggregation has occurred.
A method for aggregating unit value quality to derive a quality for the statistical result is not specified in any of the reviewed standards. The most universally adopted method for grade aggregation and propagation is a simple “least grade wins” rule. This logic ensures that the quality of time series statistic is equal to that of the worst data in the aggregation bin. But this method can be disinformative if an otherwise excellent dataset has even a single poor-quality data point.
The true quality of a statistic is therefore a more complex function of the grades of unit values and the amount of missing data. WSC uses the code “A” to identify daily values that have a data gap greater than 120 minutes. There were no explicit data coverage rules for any time scale identified in any of the other standards reviewed. The “least grade wins” rule imposes a high penalty on statistics for variability in data quality. There are no standards using more complex functions (e.g., a frequency distribution) to evaluate an aggregated grade to reduce the leverage of lower quality data that control the grade but otherwise have little influence on the accuracy of the calculated statistic.
Exactly how data are created and under what circumstances is not arbitrary. However, communication of this important context will require the definition, adoption, and use of controlled vocabularies.
Standards for Characterizing Data Quality
The characterization of data quality must be reproducible to be valuable. All parties involved must agree that the assessment of quality is valid. There must be rigor in how data are classified into each of the OGC quality categories for the purpose of communication. Characterizing data quality requires careful consideration of the degree to which the statement “fully meets standards/best practices” can be considered to be true.
Data are the result of a monitoring plan, conceived and executed with respect to the specific hydrologic, hydraulic, and environmental conditions at a given gauge. Recognized standards are available to support stream hydrographers in both characterizing and optimizing the quality of the water data they produce.
There are currently 69 ISO standards listed under Technical Committee 113–Hydrometry, with another 10 under development. ISO standards are licensed and therefore not freely available; however, those that are most germane to the evaluation of hydrometric data quality are equivalent to the publically available WMO and USGS standards.
WMO is a specialized agency of the United Nations that promotes the establishment and maintenance of systems for rapid, free, and unrestricted exchange of data and information. A key aspect of the WMO mandate is to promote the standardization for the uniform publication of observations and statistics.
USGS curates its own standards for all data products and services. Like WMO, these standard documents are all freely available for use. Both WMO and ISO standards rely heavily on the USGS references, and in many cases, are almost word-for-word identical with the USGS (with the exception of the use of International System (SI) of units).
Quality Management Systems
Data quality can be evaluated with respect to compliance with WMO, ISO, USGS, or similar standards, and an OGC quality code can be assigned to the data using ISO 19115-1:2014, NEMS, or a similar set of standards.
The credibility of the data quality is therefore dependent on the defensibility of the claim of “standards compliance.” An unsubstantiated claim of standards compliance is not detectably different than noncompliance. For a claim of standards compliance to be credible, there must be auditable documentation supporting the claim.
There are several quality management systems (QMS) in use. For example, the USGS maintains its own multilevel system of documentation that includes formal data review and auditing. The cost of a standalone QMS is prohibitive for smaller organizations, most of which choose to adopt from the ISO family of standards.
ISO 9000:2005 describes the fundamentals of a QMS and specifies terminology. ISO 9001:2008 enables an organization to demonstrate its ability to provide products that meet customer requirements and enhance customer satisfaction. ISO 9004:2009 provides guidelines for both the efficiency and effectiveness of the QMS. ISO 19011:2011 provides guidance on auditing quality and environmental management systems.
The Cost of Quality
Hydrometric data quality evaluation is a complex process. Site selection; environmental factors; selection of methods; instrument precision, calibration, and maintenance; site visit frequency and timing; and training and experience are factors that need to be managed to optimize the opposable objectives of cost and quality. Cost is a tightly controlled objective, making data quality largely dependent on the costing model for the design and execution of a monitoring plan.
High-quality data are perceived to cost more to produce than low-quality data, but mistakes made from under- or overestimating water-related risks and opportunities result in unperceived costs.
As Albert Einstein said, “Sometimes one pays most for the things one gets for nothing.”
Systematic attention to data quality is rewarded by Deming’s philosophy that “when people and organizations focus primarily on quality then quality tends to increase and costs fall over time, whereas when people and organizations focus primarily on costs, costs tend to rise and quality declines over time.”
Summary
The benchmark for “good” quality data is full compliance with defined standards and best practices. There must be an auditable process (e.g., ISO 9001:2008) in place to ensure that all data categorized as “good” have no dependence on any substandard components or data processing elements.
“Fair” quality data fail one or more of the tests for compliance with standards. This category represents the best data that result from a monitoring plan that is insufficiently funded to support full compliance with defined standards and best practices.
“Poor” quality data are compromised in their ability to represent the monitored parameter. This may be because of poor site selection; poor choices in methods, techniques, and/or technologies; or because of particularly adverse environmental conditions.
“Estimated” is a catch-all category that includes data with a wide range of quality variance. It can include data that are derived using a tightly constrained streamflow accounting process with high-quality inputs but also include data that are little better than a guess. The best way of interpreting data with a grade of “estimated” is to contact the data provider for more explanation.
“Unchecked” is not a data quality per se as much as it is a processing status. As such, it is extremely valuable for identifying whether data obtained in near-real-time have been through a preliminary screening process.
“Missing” is a quality that seems somewhat redundant. If the data aren’t there, then the data are obviously missing. However, “missing” is valuable in the context of data transport to validate to the end-user that the data are known to be missing and have not simply been lost in communication.
Evaluating fitness for purpose requires the quality of the data to be put in a broader environmental and epistemic context. There is still much work to do to establish common vocabulary to establish context for properties such as data source, background conditions, range, method, data processing status, and statistic code.
The OGC is a newcomer to hydrometry. It has laid out a framework for a data quality property that is missing from many legacy metadata management systems. The OGC structure can also accommodate a wide range of context-specific metadata in a very flexible framework.
The OGC stopped short of providing the rules for evaluating the data quality property. It is appropriate that OGC did not overstep its mandate, but this creates a gap that is not currently addressed in USGS, WMO, or ISO standards.
The NEMS standard provides an ISO 19115-style approach by which the OGC data quality property can be uniformly interpreted by multiple hydrometric data providers. International standards agencies such as ISO and WMO are community-led and prefer to adopt and adapt standards developed and broadly accepted by the community. The leadership shown by NEMS in the development of quality standards will most surely shape further international standards development.
Data Quality Management for the 21st Century. Modern civilization, valued ecosystems, and water availability are intricately interconnected. Water availability is extremely (and often inconveniently) variable in both time and space. Competing demands for both in-stream and withdrawal uses need to be managed within, and amongst, complex jurisdictional frameworks. Trustworthy data are needed to prevent mistakes. Trustworthy data are needed to resolve conflict. Trustworthy data result in better outcomes for all stakeholders.
OGC standards are making more data, from diverse data providers, accessible for decision-making than ever before. These data sources fill critical data voids at an increasingly fine spatial resolution. OGC also provides a metadata framework for communicating the information needed to evaluate the confidence with which such data can be used for any given purpose.
Imagine a world where
- Impactful decisions are made in a timely manner with high confidence.
- Decisions never result in unintended, needlessly adverse consequences.
- Negotiations are focused on trusted data rather than historical grievances.
- Collective consensus is undiminished by uninformed debate about uncertainties.
- Governance is based on relevant and timely evidence.
- Planning and policies arise from robust analysis of relevant and trustworthy data.
It is much easier to imagine a desirable future if all hydrometric data are openly shared. The communication of data complete with metadata describing both explained (i.e., context) and unexplained (i.e., quality) variance is crucial to connect shared data to its most beneficial use.
All data providers should be able to use this guidance to improve the value of their data products. Progressive improvements in monitoring efficiency and effectiveness will result from universal and unambiguous interpretation of the OGC quality property. Consumers of hydrometric data will, in turn, be empowered by improved confidence in their data. This enhanced trust will result in faster response to emergencies, improved certainty in the allocation of water, and more decisive actions for protecting water resources and the environment.
References
Lehmann, J., and M. Rillig. 2014. “Distinguishing Variability From Uncertainty.” Nature Climate Change 4: 153. doi:10.1038/nclimate2133
Whitfield, P. H. 2012. “Why the Provenance of Data Matters: Assessing ‘Fitness for Purpose’ for Environmental Data.” Canadian Water Resources Journal 37(1). www.tandfonline.com/doi/abs/10.4296/cwrj3701866?journalCode=tcwr20#.Uyht6PldVKZ.
Stu Hamilton is a senior hydrologist at Aquatic Informatics.


