“If everybody is thinking alike then somebody isn’t thinking.”
– General George Patton
Every 20 years or so, urban stormwater practitioners seem to stop and take stock of how we are doing. Sixty years ago, we figured that efficient drainage was the way to do things, using separate stormwater systems of pipes. Forty years ago, we figured out that efficient drainage was causing flooding problems and switched to a detention design standard. Twenty years ago, we found that detention ponds were failing for a number of reasons and switched to a more comprehensive master planning approach–that is, those who could afford all that modeling, understand its output, and had the wherewithal to actually construct regional systems for stormwater treatment. In the ensuing 20 years, we have seen the rapid diversification of stormwater design from a simple consideration of flooding and conveyance to channel erosion, stormwater pollution, groundwater recharge, and natural approaches to stormwater design–more or less.
One thing these past approaches to urban stormwater hydrology have in common is a focus on peak flow (and flooding) and, secondarily, on velocity. But with the onset of a focus on stormwater quality, there was a recognition that we were treating volumes of runoff because we were most often trying to reduce quantities or concentrations of (versus flow of) pollution. This often led to a sort of “Frankenstein-ian,” cobbled-together approach to stormwater design where a water-quality volume is treated, but the rest of the design was still all about peak flow.
We are now facing another sea change in thinking that is reaching “pandemic” proportions–well, in the fact that there have been a few notable conversions and a lot of talk. Recent discussion by stormwater opinion leaders is now pointing to a convergence on what we will call volume-based hydrology (VBH) and movement away from the peak-flow-based version. Many states and local communities are considering how to accommodate or understand this idea. This article is a brief summary about this convergence.
In conversations with a number of fellow stormwater practitioners, it has become apparent that there is a need for a more focused dialog on the shift to volume-based hydrology, because it is taking on a life of its own. This article is offered in hopes of stimulating some new–and renewing some old–thinking on the subject, and attempts, however imperfectly, to frame the subject.
Drivers for the Shift to VBH
VBH starts with the premise that it is the increased volume of runoff due to urban development that is causing a set of problems, and that any other focus-variable (velocity, peak flow, impervious percent, event mean concentration [EMC] reduction, etc.) is mostly a one-off approach from the real problem: increased volume. If we focus first on volume, then the other variables will fall more readily into line.
There have always been places where volume-based thinking has been the norm. Most of these places are flat, sandy or gravelly, and/or arid. They have used this approach because it is the only one that made sense–the one that reflected local reality. You may notice, as you peruse the literature or attend conferences, that the reasons given to make this switch to VBH (or a hybrid) are varied–even seemingly contradictory. For example: Houston, TX, uses it for flood control; Florida for pollution removal; New Jersey for groundwater replenishment; Spokane, WA, for stormwater removal by injection; Phoenix, AZ, for flood control by soak pits; California for erosion control; and Philadelphia, PA, for combined sewer overflow (CSO) volume reduction. Lots of different reasons.
Evidence of this shift in thinking is making its way into visible places. For example, the recent and influential National Research Council stormwater report states that efforts to reduce stormwater volume will automatically achieve reductions in pollutant loadings and that flow itself is responsible for erosion and sedimentation that adversely impacts surface water quality. The 2007 Energy Independence and Security Act (Section 438) deals with redevelopment or new development on federal facilities, stating they must seek to maintain predevelopment hydrology with respect to temperature, flow rate, volume, and flow duration. EPA’s CSO control policy “presumptive” approach has a volume-elimination option, which has led to, among other things, a green infrastructure emphasis.
In addition, rumblings out of EPA lead us to believe that a volume-based approach will begin to replace other National Pollutant Discharge Elimination System (NPDES) Phase II approaches in future permits. Such prescribed conditions might include mandated green approaches with measurable goals that specify acreage treated with green designs; mandated reduction of impervious area; total maximum daily load (TMDL) implementation through green infrastructure; and mandated capture and treat depths (e.g., 95% storm) with a hierarchy of controls: infiltration, evapotranspiration, and capture and reuse. West Virginia’s draft NPDES stormwater permit specifies capture of the first 1 inch of rainfall. Draft language offers an “offset” provision when the site cannot be developed with onsite VBH controls. Such offsets will allow investments in improvements in other areas of the same watershed or drainage area.
We are also finding that our current in-vogue measuring stick for controlling the water-quality and habitat-related impacts of urban development–percent imperviousness–is probably not doing the job. It is a very convenient, albeit indirect, measure of the potential intensity of urban-development-induced change in the natural hydrologic cycle. However, as some have noted, even when imperviousness is well controlled, there is no guarantee that a watershed or stream will be adequately protected or that its key values will be preserved. So, as a standard of measure of the problem it works well in an urban area, but as a standard of control (i.e., “If we simply reduce imperviousness we have solved the problem”), it may be destined for partial retirement, joining “population density” and “curb miles.” A more direct approach is to attempt to account for rainfall-runoff volumes, and the flux of those volumes in time, directly.
What is VBH, Really?
Stormwater is measured in different ways, reflecting its different uses. Some use acre-feet; others use watershed-inches, gallons per minute, or cubic feet per second. A few still think in terms of cubic-feet-per-second-per-inch-per-square-mile! When water is precious–when it is a commodity–we almost always refer to it in volumetric terms. When it is a common enemy to be safely conveyed and channeled, we think of it in terms of flow. Water is becoming an increasingly precious commodity, even in the eastern United States where it has always seemed plentiful. This forces us to take a look at volumes over flow rates–where they come from, where they are stored, and how we access them. So it seems VBH is a water scarcity phenomenon.
A similar application, the flip side of the coin, is the reduction of runoff volume to reduce combined sewer overflows through the use of green infrastructure (GI). Such approaches, many of which look a lot like old-fashioned stormwater treatment controls, both large- and small-scale, are coming into prominence.
Popular GI approaches span the horizon of volume-based practices. They include downspout disconnection, sheet-flow from small impervious areas to grass or gravel, filter strips, infiltration practices, small wetlands, porous pavements of all kinds, “leaky” pipe and node systems, cisterns and rain barrels, bioretention of all types and shapes, soil amendments, tree box filters, green roofs, vegetated swales (dry and wet), and extended detention. EPA has dedicated a complete website to this approach, and a whole industry is growing up around the concept.
Lessons learned from non-CSO applications are being applied in dense urbanized areas. Cities such as Portland, OR; Seattle, WA; Philadelphia; Chicago, IL; Indianapolis, IN; and Washington DC are seen as leaders in this approach, though it is still in its infancy. In these approaches, especially on a small scale, keeping gallons of runoff out of the combined system is the name of the game. So, maybe VBH is a runoff volume reduction phenomenon.
Second, there is a growing body of knowledge that the treatment of runoff is not as effective as the removal of runoff (and the mass of pollutants it carries) needing treatment. We can theoretically assign some very high pollution removal value (some would say 100% except for quick return dissolved constituents) for runoff that is captured and infiltrated or evaporated or fed into the root systems of plants and trees. We can then think in terms of mass of pollution removed (or avoided) through the stepwise consideration of impact-reducing site design, runoff interception and permanent removal using VBH, and treatment by stormwater treatment practices. Most studies have not shown this infiltrated runoff to be a problem unless the site itself is contaminated with specific pollutants of concern or injection into groundwater takes place (Weiss et al. 2008). VBH is really a stormwater pollution reduction phenomenon.
Third, it is now becoming apparent, at least in humid climates, that volume of flow over time, and not simple peak flow, is the right variable when considering erosion in many open-channel systems. In fact, peak flow controls may exacerbate the erosion problem, forcing larger volumes of flow into the channel cross section instead of allowing them to flow partially along floodplain paths. For example, some California locations have begun using hydromodification management plans to determine and control the geomorphologically significant flows to handle channel erosion. (For an example, click here.) So it seems VBH is a channel erosion and habitat protection phenomenon.
Fourth, the ability of random detention pond placement to actually control downstream peak flow has always been suspect. The goal in peak-flow-based hydrology is peak matching. The mantra for years was that site post-development peak should be equal to or less than the predevelopment peak. It is not working. In the end, the problem is as much a volume and timing concern as it is a site-based peak flow problem. Just as at rush hour where it is a traffic volume problem on undersized roadways out of downtown, every large storm creates its own rush hour of runoff. How much we create and exactly how much we park onsite matters. We are dealing with the management of volumes. So, VBH is a flood control phenomenon.
Lastly, there is intense pressure in many places for infill development to occur in floodplain areas. There is also intense pressure to recover developed flood prone areas for greener uses. Nothing so galvanizes a neighborhood to unified action as finding that its property is now mapped within a newly defined 100-year floodplain. In these situations, it is not only the runoff from upstream sites that is important, but also the timing of that runoff with respect to the volume of the flood hydrograph moving down along the main stem stream. Despite detention ordinances for onsite control, a community must still decide where along the major stream system it chooses to create major storage areas for excess flooding volume, or nature itself will make the choice. So…VBH is a floodplain management phenomenon, too.
So, in summary, depending on who you are and where you are, VBH is not simply a regulatory issue but is also driven by: (1) water scarcity, (1a) CSO volume reduction, (2) pollution reduction, (3) channel erosion and related habitat alterations, (4) flooding reduction, or (5) floodplain management needs.
A VBH Framework
For most people, there is not a systematic or focused reasoning as to why this approach might fit a local situation, but more the feeling that mimicking the predevelopment hydrological cycle to the maximum extent practicable (dare we say “MEP”?) is just a good idea–if not a regulatory idea. This deserves some consideration. The theory goes: To the extent we can make the post-development response identical to the predevelopment one, we remove the negative impact of development. To be more complete, this goal must also include the physical, dynamic, and chemical aspects of the water (pollution, velocity, temperature, etc.). This is Nirvana and presently achievable on a watershed scale only in our dreams. Yet VBH approaches are a step forward for a lot of good reasons and can be incorporated in any local stormwater program. How so?
You may have noticed that each of the issues in the previous section seemed to refer to a different consideration of the amount of rainfall–to the size of the storm. This is a key in our consideration and was recognized early on in the framing of some leading stormwater manuals.
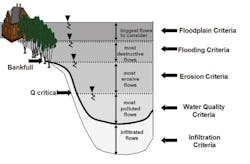
Not all stormwater is created equal. As the depth of rainfall increases from trace amounts to a real frog strangler, the runoff has different impacts, treatments, and potentially beneficial uses Figure 1 illustrates this concept. As more and more rain falls, our design concern shifts from infiltration/volume reduction, to pollution reduction, to erosion reduction, to flooding reduction, to floodplain management. In each of these five levels of stormwater management, there is a way to nudge treatment of stormwater toward VBH.
Such a framework is not new and has been described in various forms. For example, British Columbia has the Integrated Stormwater Management Planning process (BCMWLAP 2002). Chesapeake Bay has the Baywide Runoff Reduction Method (Schueler 2008). Malmö, Sweden, has adopted a similar framework in the last eight to 10 years (Stahre 2008). Pennsylvania has gone to a form of it in its recent design manual. Australia has been growing in its use of a version called water sensitive urban design (WSUD) for the past 10 to 15 years (Goyen et al. 2002).
Let’s discuss each of the five in turn, with a pause after the first three–which are often considered as a group in design situations. In order to make the discussion of these different concerns comparable, let’s talk in terms of watershed-inches of volume and use an example from “America’s Heartland” (in keeping with the trend to make all pronouncements from mid-America): Anytown, KS. Anytown has very flat topography but with highly erodible soils, so it is perfect for our needs. It also has a high water table in places and numerous excavated lakes, which complicates things somewhat–so let’s ignore that part of reality for now.
VBH Objective 1: Infiltrated Flows. The initial rainfall depth is primarily either captured as initial abstraction (or on purpose for reuse), evapotranspired, or infiltrated. Infiltration may continue throughout the storm or may peter out as soil saturation is reached. The natural infiltration depth varies with many factors such as rainfall intensity, the number of surface depressions or roughness of the surface, forest litter depth, vegetative cover, soil type and “fluff,” moisture content, layering within the soil complex, surface land use, slope, and climate.
Much of this infiltration returns to the stream over the hours and days after a rainfall event, appearing as the base-flow recession curve (the long tail) on a storm hydrograph–keeping the stream alive through dry periods. Some enters the groundwater table and serves as a source of drinking water and can feeds springs miles and centuries away.
Most locales that have begun to require infiltration of a certain rainfall depth have chosen a volume/depth such as runoff from the first inch of rainfall, first inch of runoff from directly connected impervious areas, a recharge factor tied to hydrologic soil group (HSG) and predevelopment land use, or a depth tied to average annual predevelopment infiltration. New Jersey has developed a complex spreadsheet approach (NJDEP 2004). Georgia has recently published the Coastal Supplement to the Georgia Stormwater Management Manual (ARC 2009). It requires infiltration of runoff from the first 1.2 inches of rainfall, the depth the rest of the state treats with stormwater controls.
Calculation of infiltration can be frustrating without data…or with data. It is both a flow and a mass balance problem with lots of the data missing or only roughly estimated, especially if you try it on more than a single site basis. The ability of the runoff to enter the soil is a function of both the surface entry rate and the eventual rate of the slowest infiltrating soil horizon. On a volume basis, the soil has a field capacity where moisture is held in place by pore pressure and osmotic forces and will not drain gravitationally. If rain continues, the rate of subsurface percolation or soil porosity becomes the limiting flow and volume factors. If either is exceeded, surface ponding or runoff will occur on the surface.
The most physically based modeling methods are the Horton Equation (and variants) and the Green-Ampt Equation. But both of these methods require estimates of parameters that are not intuitive to the everyday designer (do you know your soil’s suction head?), often leading to wide disparities in estimates. This makes the Soil Conservation Service (SCS) method more popular, even if it is not as accurate. Its land-use-based parameter estimation (curve number) is easy to grasp and readily tied to the kinds of land use and HSG decisions designers must make.
However, the SCS method is very inaccurate for the kinds of small rainfall amounts considered for infiltration (and pollution control, considered next). Efforts are being discussed to correct this problem by changing the initial abstraction but are not “official” yet (Hawkins et al. 2009).
But if total infiltration is the needed parameter (versus infiltration in time), a simple volumetric runoff coefficient has often sufficed, especially given all the other inaccuracies. This is shown in Equation 1, following the Q-P naming convention.
Q = P * Rv (Equation 1)
Where Q = runoff volume (inches)
P = rainfall of interest (inches)
Rv = volumetric runoff coefficient
Rv had, in the past, been expressed as a simply linear function of impervious area. However, with the recognition that soil type and treatment are also very significant when it comes to volume considerations, the Rv factor can better be understood as a weighted coefficient based on percent of site area in each identified category.
If each type of soil or land use is assigned its own Rv value, Equation 1 can be changed to:
Q = P *Σ Rvi I%i (Equation 2)
Where Rvi = runoff coefficient for a particular land use or soil condition
I%i = percent of site in that condition
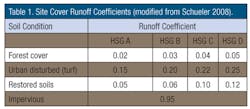
Schueler (2008) gives a table of Rv values developed from an assessment of various sources, reproduced in a modified form as Table 1.
In reality, it is never even quite this simple because of the interaction of the various land uses and the complexity of most sites. For example, drainage from smaller impervious areas may run on to green areas, partially negating the impacts of the impervious area. In fact, good designers may plan it that way. This can be handled in several ways, including estimation of a reduced Rv value for small versus large impervious areas (according to Pitt [1987], from 0.95 to 0.98 down to 0.65 to 0.85 for our range of rainfall depths), or by identifying appropriate grassy areas as a rainfall volume runoff reduction control and removing volume directly through runoff reduction calculations. There may also be planned and engineered practices for which a special and low Rv may be calculated, such as reforested areas, restored or amended soils, etc.
To meet some stipulated infiltration requirement, a designer would lay out the site to maximally reduce the Rv coefficient and increase infiltration, then develop designs for capturing and evapotranspiring, infiltrating, or reusing rainwater that will make up for any shortfall in meeting the requirement (and maybe provide some Leadership in Energy and Environmental Design (LEED) points, too).
In most cases, the modeling of many decentralized individual sites is seen as far too expensive and labor intensive, so a set of approximations to calculate total gallons removed, peak reduction, or water-quality improvement is typical (Weinstein 2006).
The law of unintended consequences (Murphy’s first cousin) will dictate that all this infiltration in an urban setting can lead to problems. For example, Northrhine-Westphalia in Germany, after years of infiltration requirements, found that water tables were rising and intersecting basements, foundations, contaminated sites, and graveyards. It changed the character of local lakes and ponds. Hydrostatic pressure lifted impermeable slabs and floors (Goebel et al. 2002). In an attempt to avoid such problems, Bardin et al. (2002) developed a 17-parameter evaluation algorithm to assess probable impacts of various kinds of infiltration approach.
So, in Anytown, if we were going to begin to require infiltration, we might think in terms of what others have done and require a specific depth of rainfall infiltration, or relate it to impervious area in some way. Or we could get more technical and try to tie it to existing or natural soil conditions–whatever that means in an urban setting. For simplicity, let’s set it at a 1-inch storm and require either infiltration or another rainfall retention method.
If we could, then, magically capture 1 inch of rainfall, this would be equivalent to a 30-minute one-year storm, an 11-minute 10-year storm; or a 6-minute 100-year storm. Based on 54 years of record, a 6-hour inter-event dry period (IEDP), a site Rv of 0.66, and conservative assumptions about continued infiltration after 1 inch is attained, 81% of all storms would be fully captured, and 79% of all rainfall volume on an annual basis would be captured for infiltration, evapotranspiration, or reuse. For a longer IEDP, the numbers would be a little different, because some of the storms would be a bit larger. And, of course, we can change things a lot by simply changing infiltration assumptions.
VBH Objective 2: Most Polluted Flows. The next increment of rainfall begins to run off and is eventually sufficient to mobilize sediments and other pollution from paved surfaces but not enough to provide significant dilution of those pollutants. When a city takes a bath after many long dry days of activity, the first 20 minutes of hard rain off of a small site or roadway is filthy–the “first flush.” We may consider this amount to extend from the first emergence of flow until, say, half bankfull. On an annual basis, this small storm depth amounts to a very high percentage of the overall flow volume.
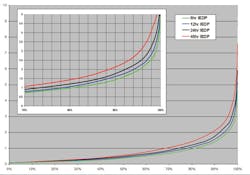
For example, Figure 2 shows a plot of 54 years of rainfall data for Anytown, was ordered smallest to largest by percent smaller (e.g., 100% of the storms are less than the maximum storm). It is done for four different IEDPs of 6, 12, 24, and 48 hours. The inset is an enlargement of the right side of the overall plot.
It is clear from this plot that if removal of some high percentage of pollution on an annual basis is the goal, then catching and appropriately treating runoff from a storm in the 1-inch to 2-inch range might be sufficient–depending on the capture and treatment percentage and the chosen IEDP. (If an infiltration standard states a certain percent storm but without a corresponding IEDP, lots of shenanigans can take place.) Our chosen depth is also dependent on the types of treatment and the distribution of storms and a suite of other factors. But to keep things simple for our discussion, we will forgo simulation modeling or calculation of maximized capture volumes.
Let’s assume that, for whatever set of reasons, the city chose the 6-hour IEDP and 85% storm depth of 1.2 inches as its water-quality volume. The choice may represent a balancing of capturing an adequate volume for high removal of most pollutants with a long enough IEDP for most fast-filtering hydraulic-head-driven stormwater controls to have largely emptied and the cost realities on the ground. This is not to say that it is a sufficient IEDP for soil moisture across the site to evapotranspire or drain away. That may take days.
Pollution removal efficiency can be calculated by measuring the EMCs of the influent and effluent and finding the median change. It can also be calculated by considering the total mass of pollution in and out by measuring the EMCs and the total flow volume.
For a standard non-VBH program, the runoff from 1.2 inches of rain would then need to be treated by structural controls. For example, for a site in Anytown with a post-development imperviousness of 70%, the Rv was calculated to be 0.66, meaning that 0.79 inch of runoff would need to be treated to the MEP standard.
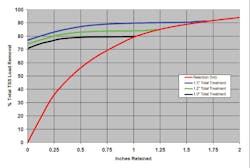
However, if we add a VBH component, we begin to better recognize the removal of pollutant mass through runoff volume reduction as well as the removal of pollutant mass through conventional pass-through treatment practices. Figure 3 shows a range of options for 0 to 2 inches of rainfall retention on the horizontal axis (combination of site layout, infiltration, and other retention controls—e.g., cisterns with
reuse) and three different total water-quality-treatment depths. In this case, total suspended solids (TSS) is the indicator pollutant of concern with an estimated EMC of 100 mg/l in the post-construction runoff.
The red curve represents volume-based treatment alone. The black, green, and blue curves represent the three total water-quality-treatment runoff depths: 1.0, 1.2, and 1.5 inches, respectively. That is: the volume reduction plus treatment of the remaining rainfall depth and subsequent discharge as treated effluent (aka, runoff).
If 20 mg/l in the effluent (i.e., 80% TSS load removal from the 100 mg/l influent) on an average annual basis were the target, then several combinations of volume reduction plus treatment could theoretically attain that target.
For our example, we will use a 1-inch infiltration or capture standard and an additional 0.2 inch of treatment (making a 1.2-inch total treatment depth). Based on an approximate analysis of 54 years of rainfall (1,900 runoff-producing storms), 79% of the runoff was treated with volume-based practices (as per VBH objective 1), and an additional 7% with treatment-based practices (which can produce 20 mg/l of TSS in the effluent or better), and a total of 84% of the TSS mass was removed.
This value is significantly higher than has been attained with a consideration of treatment practices alone, though there are many of the potential objections and disclaimers that may be appended to this short paragraph. Perhaps the main ones in our case are that some of the mass removed may be discharged in a subsequent storm and some of the flow in larger storms has still been bypassed—though accounted for in the calculations (Jones et al. 2008).
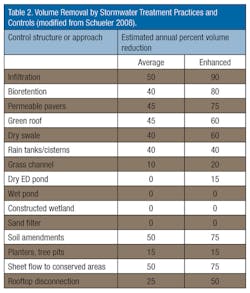
Various standard stormwater treatment practices designed to remove pollutants in the effluent have been shown to also play a role in runoff volume reduction, though the significance of this was not realized early on because most investigators simply measured pollution concentrations in and out without regard to lost mass of pollution due to runoff reduction.
Table 2 indicates the magnitude of volume removal for well-designed controls, Table 2 is derived from Schueler’s work for the Chesapeake Bay (Schueler 2008). The reader is encouraged to go to that work for derivation details. The “enhanced” column in Table 2 refers to additional design features, including increased treatment or runoff reduction volume, enhanced geometry, restriction of run-on flows, vegetation changes, and the use of a treatment train (multiple treatment methods).
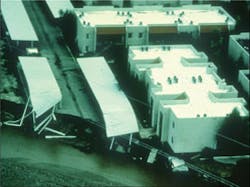
VBH Objective 3: Most Erosive Flows. Some streams are blown out by a single large storm and may move many feet laterally. For example, years ago some streams in the Pima County, AZ, area moved tens of feet sideways during one storm event, leaving bridges as high and dry art pieces and seemingly safe developments hanging over stream banks. (Figure 4). This is the exception, not the rule. Bank erosion in most humid areas is more gradual, though just as certain.
We know that sediment is transported when the shear force in flowing water exceeds the ability of the bank and bed materials to withstand that force. Shear force varies linearly with depth and with a power of velocity (depending on the sediment transport relationship used) and is commonly taken as:
τ = γRS (Equation 3)
Where Ï„ = shear force in lb/ft2
γ = specific weight of water, 62.4 lb/ft3
R = hydraulic radius of the stream, ft
S = the energy slope of the water surface, ft/ft
This shear stress (or force) acting over time (“work” or “impulse”) moves sediment downstream, pulling on bed and banks. The longer and stronger the force acts, the more sediment is moved. Erosion is a natural phenomenon, and streams tend to vary back and forth around a balancing of sediment input sources and transport capacity. This is called being “in regime.” Local turbulence and velocity fluxes at fallen trees and rocks (or your feet at the beach) will cause local scour holes. The work of man will alter this balance in ways that are both immediate and long-term.
For example, most streams in the Piedmont area of North Carolina are overstuffed with sediment laid down years ago from poor farming practices. The now-depleted farmland has been left to return to forest. Runoff is now much more clear and “hungry” for the sediment. The streams are poised to return to presettlement slopes and configurations with reemergence of old relic tree stumps. Urban development then unleashes increases in flow volume, leading to intense streambank erosion, main stem base level lowering, and headcutting up urban tributaries. In that case, and counterintuitively, sediment-laden flow from poor construction practices may actually slow stream erosion by returning the stream to a temporary but unnatural balance!
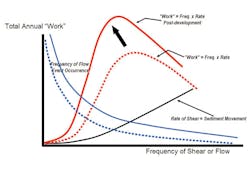
Flow increases along the horizontal axis, left to right. Small flows on the left occur often. Urban development shifts the work curve up and left. In many urban settings, the flow that corresponds with the peak of work is in the one-year storm range—at depths from half bank-full to bank-full for normal streams. The theory is, if we can control the amount of work done in the range of the one-year post-development storm, we can greatly reduce the erosion done by the stream.
Figure 5 illustrates the general concept. The black curve is the shear force as flow increases along the horizontal axis, left to right. The blue curve is the flow-duration relationship—that is, the relative amount of time that a particular flow occurs. Small flows on the left occur often. The red curve is the product of shear force times flow duration—that is, work. Urban development shifts the work curve up and left. In many urban settings, the flow that corresponds with the peak of work is in the one year storm range—at depths from half bank-full to bank-full for normal streams. The theory is, if we can control the amount of work done in the range of the one-year post-development storm, we can greatly reduce the erosion done by the stream.
Reduction of erosion is done a variety of ways, mostly having to do with overcontrol of the one-year to two-year runoff through extended detention—12 to 24 hours on average. The theory is that this will reduce the shear force and work done below the critical or threshold shear needed to mobilize sediment, thus reducing erosion. Other criteria require the infiltration of the difference in pre- and post-development one-year or two-year runoff volumes. The additional cost to provide channel protection with a 24-hour drawdown has been found to be between 10% and 20% more than a conventional detention pond (Gentry 2009).
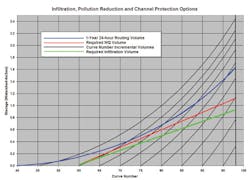
Considering the First Three Objectives Together. At this point, we should pause and consider that many purveyors of design standards handle the first two VBH objectives in conjunction with each other. Some add the third (channel protection). Figure 6 carries our Anytown design site one step further by adding a channel protection requirement. How do required volumes compare?
We might look at several options. The difference in total runoff volume for the one-year, 24-hour storm (2.72 inches) can be found by beginning at the horizontal axis and choosing the predevelopment curve number. Then run your mechanical pencil tip(!) along that curve up and to the right until you cross the vertical axis of the post-development curve number. The value on the left-hand vertical axis is the volume difference in watershed-inches. So, for example, if development on our site takes it from a predevelopment curve number of 60 to 90 (80% impervious), the difference in runoff volume for the one-year, 24-hour storm is about 1.5 inches.
If we were to route the one-year storm through 24-hour extended detention instead of treating the difference in volume with infiltration, the required pond storage volume would be 1.15 inches.
For this particular site and water-quality volume requirement (1.2 inches), the water-quality depth to be treated is 0.9 inch (red curve), and a 1-inch infiltration requirement is the green curve: 0.75 inch.
These requirements are normally “nested” within each other. That is, if you handle the water-quality or infiltration requirement on this site, you automatically would have taken care of the part of the channel protection requirement. If the water-quality requirement were some larger value (say 1.6 inches).
So, the steps to handle all three requirements might be to (1) lay out the site to reduce the Rv value (or its design equivalent) as much as possible using green (better, smart, sustainable, environmental, low-impact—pick your moniker) site-design practices while maintaining the development purpose and economics; (2) use volume-reducing practices to complete meeting the infiltration objective; (3) add any additional treatment practices to meet water-quality requirements; and (4) add any additional treatment to meet channel protection requirements. Or it can simply be handled with volume reduction, which is conceptually simple but may be harder and more costly.
VBH Objective 4: Most Destructive Flows. Back to the story line. As overall volume increases grow larger, the ability to infiltrate that increase onsite becomes problematic. This inability to infiltrate volume increases may take place anywhere along the continuum of ever-increasing storm events (at the pollution reduction or channel protection objectives), but is almost certainly encountered when we begin to consider storms larger than the two-year return period. For our example, the increase for the one-year storm was about an inch. The increase in runoff for the 25-year storm is 2 inches.
At this point, our approach begins to seek to delay or manage excess volumes onsite (i.e., detention) that cannot be removed through infiltration or other means.
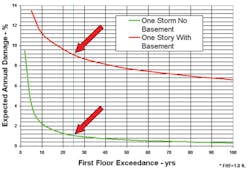
Figure 7 shows a set of standard depth damage curves with damage expressed on an average annual basis as a percent of depreciated replacement structure value. One thing we can see from these curves is that the “knee” in the curve is in the range of the 25-year storm. That is, average annual damages begin to escalate rapidly when a home’s first floor slips below the 25-year storm flow elevation.
Given “damage avoidance” as a suitable goal for flood control, then the most bang for the limited buck is to keep all structures out of or above the 25-year floodplain. Of course, the 100-year storm is used for floodplain management—which is next. So we look to onsite practices unless there is a coordinated development sequence that allows for multiple sites to coordinate practices.
Detention at the bottom of the watershed near the stream is normally nonsensical. It simply delays its own outflow peak until the upstream peak is passing by. It is poor volume management even if it is convenient and “consistent” peak management. Communities looking past peak-flow control to volume-based control have taken a number of approaches to reduce the peak flows and to time the volume increases to take maximum advantage of flow-way capacity in a manner similar to the timing of traffic lights to ensure maximum flow of traffic within the capacity of the roadway system.
Having accurate master plans and real-time models is the best way to do that—and to impose design requirements on the nuisance flooding volumes rather than just the peaks. Short of that, some communities require designers to create their own individualized “mini-master plans” and to look a certain distance or a number of crossing/conveyance structures downstream. Debo and Reese (2003) developed the “Ten Percent Rule,” which requires designers to look at the site outlet and at each major stream junction downstream to the point where their property is 10% of the total area draining to that point and ensure that there is no peak flow increase. Modeling has shown that any increases will become vanishingly small compared to the total flows. The idea is not to allow a peak flow increase at those check points. It is direct and straightforward but requires offsite calculations and potentially a knowledge of other pond effects (ARC 2001).
Alternatively, a volume-timing approach has been developed, which requires post-development volumes of flow to be less than or equal predevelopment volumes during a critical period of the 24-hour design storm—hours 11 through 18. It has the advantage of needing only site information but the disadvantages that the calculations can be awkward and it cannot provide detention waivers, as it does not consider the rest of the watershed.
There are a number of other approaches that all rely on rules of thumb (most tested by modeling) to attempt to control flooding due to volume-increase effects. The Denver area has gone to a “full-spectrum” design approach, which amounts to overcontrol of a lesser storm but with effects through the flood control design storms. Some communities in the upper Midwest use a requirement to reduce the post-development 100-year storm to a lesser pre-development target. Wake County, NC, requires a target curve number to be met for a short-duration storm. Australian stormwater engineers make a good case for retention requiring less volume than detention when done using their WSUD approach and focusing on the volumes that actually cause flooding.
VBH Objective 5: Biggest Flows to Consider. By policy, most communities consider the 100-year peak flow as the largest discharge they need to accommodate. Some communities choose the full-buildout 100-year storm discharge. Everyone lives in a floodplain of some risk magnitude. If Noah floats by, we will all be under water. But it is common knowledge that the minimum Federal Emergency Management Agency (FEMA) program for flood insurance is not a very comprehensive floodplain management program. It is an often-outdated snapshot in time, which allows valuable volume storage to be encroached upon, does not go far enough upstream, and is generally applied on a location rather than an elevation basis.
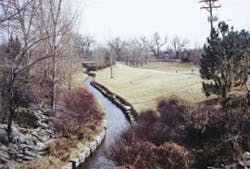
There is a longstanding desire to recover and reuse floodplains for multiple objectives, one of which is volume storage for large stream flooding. Houston, for example, requires designs to store a certain portion of the runoff volume onsite and, in cases where the flood level on the stream is above the detention level, to allow for two-way flow into and out of near-stream detention ponds. Denver, among other places, recognizes that for the flood control objective, it is not the initial volume that is critical—most streams can handle the rising limb of the hydrograph. But it is the flows near the peak of the volume-flux that matter. In that case, they seek to reserve floodplain storage until flows that would actually cause flooding occur. This is done through sidechannel spillway arrangements, such as the one shown in Figure 8, where the storage area is built into the neighborhood and the “orifice” for the control is a purposely undersized bridge opening with beveled edges. The soccer field on the right is the flood storage area, and the sidewalk-topped berm is the spillway. Detention done in this way is the most effective because it directly reduces flow at the peak.
However, even though Figure 8 shows a soccer field for multi-objective use (one of the best in Denver, I am told), others may want a more natural look such as that shown in Figure 9 from South Denver. In that case, values such as habitat and flow filtering predominate. It is not as effective for flood control, because storage is taken up as the hydrograph passes, so only a small increment of the highest flows are attenuated. Lots of objectives.
Example Completion
We can now return to our example. Anytown has decided it needs to meet all five VBH objectives because it has all five needs locally. Thus, the city has decided to require developers to:
- Infiltrate or otherwise capture the first 1 inch of rainfall
- Remove at least 80% of the mass of TSS assuming an urban average of 100 mg/l influent
- Use 24-hour extended detention or volume reduction on the one-year storm runoff difference for channel protection
- Detain the 25-year storm so there are no peak-flow increases downstream to the 10% point
- Participate in channel storage programs in accordance with any existing master plans
Initial site calculations show our Rv value to be 0.75. We are able to reduce the site Rv to 0.66 through taking advantage of sheet flow of smaller impervious areas across suitable grassy areas. While 0.34 inch infiltrates naturally, we still need to capture 0.66 inch to meet the infiltration objective. Based on Figure 3, and taking advantage of VBH, we can also meet the 80% mass removal requirement with our 1-inch capture standard. If the TSS standard were higher, we would need to either increase our capture depth or treat an additional depth.
Based on performing “what if” analysis with the visual basic site-design tool conveniently provided by Anytown, we are then able to take care of both the infiltration and water-quality requirements using suitable volume-reduction practices and controls (bioretention, infiltration, a green roof, pervious surfaces, and planter boxes).
This takes care of Objectives 1 and 2.
For Objective 3, channel protection, we will use the curve number method here, but any acceptable rainfall-runoff approach would suffice (e.g., SWMM Runoff Block). We determine that the difference in one-year runoff from a curve number of 60 to one of 90 is 1.5 inches. Based on the difference between the pre- and post-development Rv values, we find that we have already captured 0.655 inch. This leaves 0.845 inch of runoff to deal with to meet the channel protection objective.
We can either remove this volume or delay this volume based on the design standard for Anytown. We determine that we will route the remainder of the volume up to the erosion control depth through extended detention in the same pond we intend to use for the 25-year storm. Because we have artificially removed volume, we must be careful that the model we use can handle this. If it cannot, we can use an expedient by “tricking” the model through use of a lower curve number reflecting the lower runoff depth. Equation 4 is convenient for this purpose.
CN = 1000/[10 + 5P +10Q – 10(Q² + 1.25 QP)½] (Equation 4)
Where CN is the SCS curve number and other variables are previously defined
Though we will check the 10-year storm, it is typical that all intermediate storms, two-year through 25-year, will be suitably attenuated if we handle the one-year storm this way and then the 25-year storm using the no-downstream-increase method (the Ten Percent Rule).
For Objective 4, flood control, we use standard detention (with water-quality enhancement features such as a natural buffer and safety bench) for the 25-year storm and look downstream at the next three junctions—the distance required to ensure our site is only 10% of the total drainage area to the last junction. However, we have artificially taken flow out of the runoff through infiltration that is not reflected in the post-development curve number of 90.
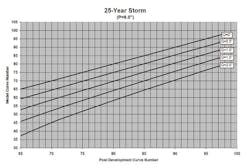
Figure 10 has been constructed using Equation 3 to allow for quick assessment of a “modeling curve number” that subtracts the requisite depth of runoff and produces a lower curve number to trick the model. It is not exact but handles detention situations adequately.
Based on calculations, we find that we have actually removed 0.655 inch of rainfall that is not reflected in the curve number. Using a curve number of 90 and 0.655 inch of volume removal, we interpolate the model curve number to be 84. This is the value we will use for detention modeling.
When we look downstream, we find that the first junction shows a slight peak-flow increase, even though at our pond outlet everything is fine. We slightly decrease the outlet size (increasing the storage requirement) and all is well.
With reference to Objective 5, floodplain management, in our particular community all floodplains have been cleared of structures at the existing 25-year level, and detailed Ten Percent Rule adherence is anticipated to essentially hold the line on that storm. A master plan has indicated that for flows above the 25-year storm, downstream storage has been provided through a side-channel spillway arrangement, and we will be asked to contribute our proportional cost of construction—which, of course, we are glad to do.
Conclusions
As Mark Twain said, sacred cows make the best hamburger. For various and often good reasons, there is a growing awareness of the need to handle stormwater and runoff with more focus on volume as a basis for design and decision making. It is making its way into America’s midsection and widely into the minds of regulators—federal, state, and local. This will bring with it a set of concerns; a fairly steep learning curve about criteria requirements, designs, and practices; and probably a number of failures. The shift toward VBH is a good thing, and making the shift carefully and gracefully will help ensure its long-term effectiveness. Some sacred cows will be butchered…and need to be.
Balance, balance, balance.
Einstein said, “Premature responsibility breeds superficiality.” That is especially true when it comes to involuntarily imposed responsibility. There is a wide but scattered body of knowledge out there that can be very helpful to those attempting to shift to VBH approaches and thinking. In any such shift, there is always a temptation to avoid doing the hard work of trying to learn from such sources and to simply prescribe some criteria or standard that is in line with emergent thinking but may be at odds with the realities on the ground in the local setting. The process of movement through change is as important as the change itself. Many have been around to see several such stormwater-related shifts, and those who have taken the time to try to deeply understand the problem, to understand the local milieu in which it exists, and to build consensus have been most successful.
On the other hand:
A centipede was happy quite,
Until a frog in fun
Said, “Pray, which leg comes after which?”
This raised her mind to such a pitch,
She lay distracted in the ditch
Considering how to run.
—Anonymous
We can also make the opposite mistake and listen to the dire warnings of some who may offer real and extant complexities and hurdles (not to mention the fact that development will cease as we know it if we do this!), but without suggested answers. There are many unknowns, and the devil will be in the details. This can paralyze us to inaction. Like the centipede, we will put all this into the “Too Hard” box on our desks and move on to other things. This will be a mistake. We should proceed cautiously, stay within the boundaries of what seems to make sense, understand why a particular environment may, in fact, not fit some blanket pronouncement, and monitor and inspect realistically.
And we should try not to let judges dictate the final outcome.
As stated at the beginning, this article is offered in hopes of stimulating some new, and renewing some old, thinking on the subject, and attempts, however imperfectly, to frame the subject and give some technology tidbits. If the only thing you get from it are some good Web links, then it has had some value. If, on the other hand, you are galvanized to determined but careful action, then it has worked perfectly!
References
Atlanta Regional Commission. 2009. Coastal Stormwater Supplement to the Georgia Stormwater Management Manual. www.georgiastormwater.com.
Atlanta Regional Commission. 2001. Georgia Stormwater Management Manual, Volume 1. www.georgiastormwater.com.
Bardin, J.-P., S. Barraud, E. Alfakih, and M. Dechesne. 2002. “Performance Assessment of Stormwater Infiltration Strategies: A Multi-Indicator Approach.” Proceedings of the 9th International Conference on Urban Drainage, EWRI ASCE.
British Columbia Ministry of Water, Land and Air Protection. 2002. A Guidebook for British Columbia Stormwater Planning. www.env.gov.bc.ca/epd/epdpa/mpp/stormwater/guidebook/pdfs/stormwater.pdf.
Debo, Thomas N., and Andrew J. Reese. 2003. Municipal Stormwater Management, 2nd ed. CRC Press.
Gentry, Lee, AMEC Earth & Environmental Inc., personal communication.
Goebel, P., S. Fach, H. Kories, W. F. Geiger, and W. G. Coldewey. 2002. “Effects of Stormwater Infiltration on the Water Balance of an Urban Area.” Proceedings of the 9th International Conference on Urban Drainage, EWRI ASCE.
Goyen, Allan G., Stephen J. Lees, and Brett C. Phillips. 2002. “Analysis of Allotment Based Storage, Infiltration and Reuse Drainage Strategies to Minimize Urbanization Effects.” Proceedings of the 9th International Conference on Urban Drainage, EWRI ASCE.
Hawkins, Richard H., Timothy J. Ward, Donald E. Woodward, and Joseph A. Van Mullem, eds. 2009. Curve Number Hydrology State of the Practice. American Society of Civil Engineers.
Jones, J., J. Clary, E. Strecker, and M. Quigley. 2008. “15 Reasons You Should Think Twice Before Using Percent Removal to Assess BMP Performance.” Stormwater, January/February 2008.
National Research Council. 2008. Urban Stormwater Management in the United States. Washington, DC: National Academies Press.
New Jersey Department of Environmental Protection. 2004. New Jersey Stormwater Best Management Practices Manual. www.state.nj.us/dep/stormwate/bmp_manual2.htm
Pitt, R. 1987. Small Storm Urban Flow and Particulate Washoff Contributions to Outfall Discharges. Ph.D. dissertation submitted to the Department of Civil and Environmental Engineering, University of Wisconsin, Madison.
Schueler, T. 2008. Technical Support for the Bay-wide Runoff Reduction Method. Chesapeake Stormwater Network.
Stahre, P. 2008. Blue-Green Fingerprints in the City of Malmö Sweden. Malmö, Sweden: VA SYD.
State of West Virginia. NPDES Permit No. WV0116025, Draft. (All eyes are on this one!)
Weinstein, N. 2006. Decentralized Stormwater Controls for Urban Retrofit and Combined Sewer Overflow Reduction, 5-1. Water Environment Research Foundation, Report 03-SW-3.
Weiss, Peter T., Greg LeFevre, and John S. Gulliver. 2008. “Contamination of Soil and Groundwater Due to Stormwater Infiltration Practices.” University of Minnesota Stormwater Assessment Project, SAFL Project Report 515, June 2008. http://library.safl.umn.edu/docs/pr/pdf/pr515.pdf.
