Why properly characterizing large storms is critical for stormwater professionals
Introduction
On April 12, 2023, a small region of South Florida near Fort Lauderdale experienced over a foot of rain in a few hours. An event of this magnitude was quantified as a 1,000-year storm and quickly made national news. When storms like this make national news, the audience is often left with the mistaken impression that we should not see storms of this magnitude more than once every 1,000 years in the country. Similarly, when a storm of this magnitude is reported in regional news, the audience is often left with the mistaken impression that storms of this magnitude should not occur anywhere in that metropolitan region more often than once every 1,000 years. But this is simply not true because rainfall statistics are published for point rainfalls, not for metropolitan regions or the entire nation.
The confusion is caused by vague descriptions of the 1,000-year storm and what the term means. Such broad characterization of large storms is misleading and problematic for the civil engineering profession, who relies on such statistics for conveying the basis of design of critical infrastructure to the public. An opportunity exists for stormwater management professionals to educate the public and elected officials about the expected frequency of large storms.
Rainfall statistics published for point rainfalls
Public understanding of the frequency of these large storms is critical for the civil engineering profession's credibility. Yet this topic is often misunderstood and mischaracterized. This issue arises because rainfall statistics are computed at a single geographic point. A geographic area as large as the U.S., which is something like 10,000 times larger than the Fort Lauderdale area, will most likely experience such a storm every year (the probability is 99.995% that at least one 1000-year storm will occur each year somewhere in the U.S., assuming 10,000 independent areas of this size in the U.S, from the formula 1 – 0.999 ^ 10,000.)
Reporting can give the mistaken impression that a 1000-year storm should not happen anywhere in a large region and even the entire country for a thousand years, because precise enough language is not used. Precise language and context are very important in science and engineering for conveying information. For example, a precise statement about the Fort Lauderdale storm would be that several storms of this magnitude could occur somewhere in the U.S. every year, but the exact location in Florida that experienced this large storm should expect to see a storm of this magnitude on average only once in a thousand years. That may seem like a subtle language clarification, but the difference between point rainfall frequencies and regional rainfall frequencies are huge.
Example regional rainfall analysis for Detroit, Michigan
Like the Florida storm event, the city of Detroit experienced a 1000-year storm in June of 2021 over a portion of the city that caused extensive flooding and property damage where the storm occurred. This storm also provides an opportunity to educate the public and elected officials about the expected frequency of these storms.
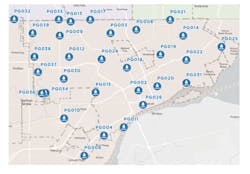
To illustrate the differences between point and regional rainfall statistics, a regional rainfall analysis was performed using 11 years of data from 33 rain gauges within the city of Detroit as shown in Figure 1. For the analysis, rainfall frequencies were recomputed for this area (rather than a single point location) to understand rainfall frequencies for a larger region. The city of Detroit is one of the largest cities in the U.S. by land area comprising 143 square miles, making it an excellent example to illustrate these differences.
The observed rainfall frequencies of the individual gauges were checked against published rainfall frequencies to confirm that they are consistent with published point frequency values. In general, the individual gauges had rainfall depths that were 5 - 15% higher than published in NOAA Atlas 14 for recurrence intervals ranging from 2- to 25-years. The slight elevation of rainfall depths could be the result of climate change or statistical variability in the rainfall in this region. In either case, the values are near those published in Atlas 14. This consistency with published values makes the data valid to use for a regional rainfall analysis.
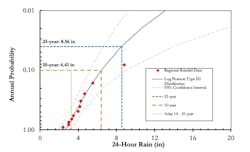
The regional rainfall analysis computed regional rainfall statistics for the entire city of Detroit, so that the regional statistics could be compared to point rainfall statistics to show the impact that geographic area has on rainfall statistics. The regional rainfall statistics were generated by computing the rainfall frequencies for a 24-hour duration using the largest storm in each year at any of the 33 rain gauges. Data was analyzed for 2010-2020, which represents a sufficiently long period to analyze rainfall statistics, and high-quality data was available for this period. A Log Pearson Type III function is used with a skew that was determined from a best fit line to the data points, and this curve is used to compute the rainfall statistics. The results of the regional rainfall frequency analysis are plotted in Figure 2.
Tables 1 and 2 compare the regional rainfall values to those from NOAA Atlas 14 for a point rainfall. The findings presented in Tables 1 and 2 may come as a surprise to elected officials, system managers, and even many of the engineers advising them. Take for example the 100-year storm with a point rainfall of 5.13 inches. The regional analysis suggests that storms of this magnitude are likely to happen once every 5 years somewhere in the city of Detroit. This would probably be a surprise to stakeholders who might expect that a 100-year storm would only happen on average once every 100-years somewhere in the city. But because rainfall statistics are published for a single point, and the city of Detroit has a very large geographic area, a 100-year storm is likely to happen 20 times more frequently somewhere in the city’s 143 square miles than once every 100-years.
Table 1: Comparison of 24-hour rainfall depths
Table 2: Comparison of 24-hour rainfall recurrence intervals
Particularly surprising is that the analysis shows that a 1,000-year storm with a point rainfall of 7.38 inches, like the frequency of the storm that occurred in June of 2021 in the City of Detroit, is likely to occur on average once every 13.7-years somewhere in the city of Detroit. This finding shows that storms of such magnitude should be expected to occur somewhere in the city of Detroit with a far greater frequency than most people may have been thinking. The regular occurrence of very large depth storms in the region that cause widespread flooding is not an extremely rare or unusual event. In fact, we should expect that those types of storms will occur with some regularity (perhaps once every decade or two) somewhere in Detroit. This context is quite consistent with what has been observed in the region. A proper understanding of regional rainfall recurrence interval has a profound effect on flood control and resiliency planning and suggests that much larger storms should be used for designing critical infrastructure if entire regions are to be considered for resiliency planning.
Conclusions
One may hear of news reports of large events and notice that they appear to occur more frequently than they might expect (i.e. a 100-year storm is reported in the news in the Detroit region more often than once every 100 years). A casual observer not well versed in what these rainfall statistics mean might be tempted to blame this on climate change, but the dynamic described here is not the result of just climate change. It is the result of the large size of the city of Detroit and the fact that rainfall frequencies are published for a point rainfall, not regions. This regional rainfall effect will occur in any metropolitan area with a large geographic extent.
Climate change may exacerbate this dynamic in the future and drive larger rainfalls, but it is not the root cause of the dynamics described here. The root cause is inappropriately applying point rainfall statistics to large regions, which have very different expected rainfalls. Differentiating between point rainfall statistics and climate change is important because we must properly identify the root causes of problems properly if we are to solve them. Without a proper understanding of these regional rainfall dynamics, it is possible that decision makers could spend millions to improve their systems for climate resiliency, and still fall far short of their expectations of level of service in their systems if these regional rainfall statistics are not also properly understood and accounted for in system designs.
It is a disservice to the public and elected officials when stormwater professionals do not properly give context to declarations of estimated storm recurrence intervals. As stormwater professionals, we must give proper context to large observed rainfall events. We risk the credibility of our profession and the trust of the public if we do not.
About the Author
Robert Czachorski
Robert Czachorski, P.E., OHM Advisors.
William Gonwa
William Gonwa, Ph.D, P.E., Milwaukee School of Engineering.


