Anyone who has used flood hazard maps is familiar with the limitations posed by 2D views of predicted flooding and flood mitigation options. But advances in technology combined with innovative approaches to flooding data are creating a greater ability to visualize multiple data sources and flood flow details — such as velocity, intensity, multiple storm event elevations, flood mitigation scenarios and water-level height locations — simply by standing on site and looking at a mobile device.
“There is so much data out there today, but most people don’t even know it’s there or how to use it,” said Shawn Allan, vice president of digital and technology at WSP. “What we’re trying to do is get this information into a form that can be used to help people.”
Allan said that this led WSP to invest in FloodVue, a digital tool that uses augmented reality to help landowners and communities visualize flood scenarios and develop an immersive picture of severe weather impacts before they occur.
“We knew this was the future way of communicating what risk looked like and that it would spur people to action in a much more urgent manner,” he said.
Today, FloodVue is one of 10 tools developed by WSP as part of the ClimateVue suite, all of which are aimed at enabling better, smarter and more resilient decision-making. The key element in any successful tool for accurate flood risk forecasting is the ability to measure relevant data from multiple sources and turn it into something useful by align- ing it to address a specific need and enabling the user to make decisions more quickly and confidently.
“We decided to strategically invest in these technologies, based on input that came from our teams that work closest with our clients,” Allan said. “Some of the digital technologies deal with short-term risk, while others are focused on long-term risk. You really need both.”
When extreme weather strikes
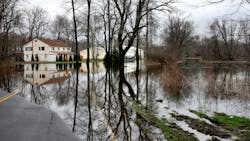
In mid-April, more than 25 inches of rain fell at the Fort Lauderdale-Hollywood International Airport within a 12-hour period, causing major flooding. The U.S. National Weather Service called it a 1,000-year event that topped the previous one-day record of 14.59 inches set in 1979.
Another 1,000-year event occurred in July when 7 inches of rain fell in three hours in New York’s Hudson Valley, causing flash floods that washed out roads and trapped people in their vehicles.
In neighboring Vermont, which also experienced about two months’ worth of rainfall within a 48-hour period in July, concerns were raised about the state’s 363 dams, more than half of which were already classified as a high or significant hazard on the U.S. Army Corps of Engineers National Inventory of Dams.
“Weather incidents, like these, high- light the danger of using only historical flood information when designing roads, bridges, buildings and other assets, because they might be under-engineered,” Allan said.
One way infrastructure resilience is improving is through the use of tools, like WSP’s ClimateEVA (Extreme Value Analysis), that provide dynamic precipitation-frequency analysis based on projections from global climate models. Designed for long-term planning purposes, ClimateEVA provides users with the information they need to help them understand how extreme precipitation can impact their region or specific assets. Planners and designers can apply these future precipitation values from ClimateEVA into physical models to assess vulnerabilities of existing or planned infrastructure. They might find, for example, that a culvert opening should be upsized, or a critical facility will need to be relocated due to new climate future realities.
Monitoring local rivers & streams
For buildings and infrastructure located near rivers and streams, awareness of multiple scenarios is key to understand- ing what flooding risks are possible and what might be necessary to prepare and protect the property in those situations. Allan said emergency managers are using WSP’s RiverSignal tool in the ClimateVue toolkit to acquire this data, which provides users with individually customized flood alerts, from the National Water Model, for rivers and streams in their location.
“It puts real data into the hands of informed users, like emergency managers, floodplain and emergency response managers, as well as dam operators, who can create pre-set flood alerts based on critical water-level exceedance thresh- olds,” Allan said.
The forecast model incorporates data not only from stream gauges but also spatially distributed data, and alerts
are customizable to each geography. Typical uses include alerting for targeted streamflow monitoring events, which is common for environmental compliance projects. When coupled with advanced hydraulic models, other uses may also include notifications on critical water surface elevations, such as whether flows will hit the low chord of a bridge deck
or overtop it.
Uses for this tool also include assessing dam safety or condition; determining if flows will result in a water surface elevation that hits the low chord of a bridge deck, overtops a bridge deck, or can safely pass through the bridge opening; and determining whether nearby buildings (from critical infrastructure to residential homes) will be encroached on by flood waters.
Tracking extreme weather risk
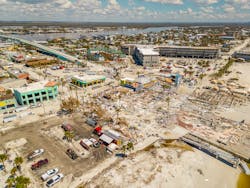
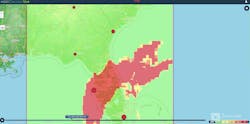
When Hurricane Ian made landfall in Florida on Sept. 28, 2022, it slammed the coastline as a Category 4 hurricane with maximum sustained winds of 155 mph. Fortunately, another ClimateVue tool, DecisionVue Harsh Environments, pro- vided alerts used for helping mitigate and prepare for storm-related flood risk. DecisionVue Harsh Environments is a short-term probabilistic weather risk assessment tool that provides an understanding of risks associated with extreme weather events, such as tropical activities, hurricanes or intensifying low- pressure systems, that could take place in the immediate or near future.
The tool creates an easy-to-read visual representation of the risk areas, using colors in the spatial analysis to indicate the risk range of flood potential on a scale of one (green) to five (red). The users can also receive alerts when their risk criteria are met. Clients also use the tool to make rapid and accurate operational decisions to mitigate risk when scheduling and planning for their busi-ness operations.
“DecisionVue uses analytical tools that integrate weather modelling, observation management, forecasting artificial intel- ligence, fuzzy logic thresholds, outlier weighting and temporal risk decay along with spatial/temporal uncertainty modeling to identify probability and risk associated with weather hazards,” Diar Hassan, PhD, a senior scientist at WSP, said.
Though tools within ClimateVue, which recently earned the 2023 Sustainable Product Award from SEAL (Sustainability, Environmental, Achievement and Leadership), can provide the most useful and accurate information possible, it is essential that they continue to evolve
and innovate as data becomes more robust, as conditions shift and as technol-ogy advances.
“We’re never done with these tools,” Allan said. “Technologies change quickly and it’s essential to always be moving forward. The key is to take all of the data that’s available — including climate models which cover the globe — and condense it into something that’s usable, that’s accurate and that can lead to fast decision-making. This is how we can protect lives and assets.”
About the Author
Kathleen Saal
Kathleen Saal is a member of the communications team for WSP. Saal can be reached at [email protected].
Sign up for our eNewsletters
Get the latest news and updates


