Nest Environmental Services has accumulated more than 1,000 stormwater samples and analysis, at the rate of 50 to 60 samples per year, for over 20 years. We thought it would be instructive to look at the results of that monitoring to see whether there was any long-term trend in the levels of contamination and secondly whether there were any correlations between the various contaminants required for testing.
In 1994, Nest Environmental Services began consulting for small businesses such as automotive salvage yards, scrap metal recyclers, cement manufacturers, and other businesses in regard to their management of hazardous materials and stormwater runoff. That year, California’s State Water Resources Control Board (SWRCB) had issued regulations (industrial stormwater permit) for stormwater management. This required businesses with outdoor facilities and activities that could contaminate stormwater to monitor and implement best management practices (BMPs) to prevent contamination of stormwater runoff.
Since different types of businesses would have different mixes of contaminants, we choose a particular SIC code and analyzed the data for that group. This article presents the following: 1) an overview of the data and their properties, 2) a description of 20-year trends in median and arithmetic mean values for the contaminants, 3) correlations among the contaminants, and 4) discussion of potential management strategies.
Description of the Data
The SWRCB’s permit prescribed the contaminants that permittees needed to monitor: pH, conductance (cond), total suspended solids (TSS), and total organic carbon (TOC), and more recently oil and grease (O&G), copper, lead, zinc, iron, and aluminum. California has nine Regional Water Boards representing different watersheds, and two of the regional boards shifted their choice of metals over time.
There was no consistent control group over the years. Clients came and went. Two samples were required: at the beginning of the rainy season and somewhere in the middle when rain was sufficient to obtain a decent sample. Various clients, the auto dismantlers, collected some 50 to 60 samples per year for 20 years—more than 1,000 samples—that were analyzed by California-certified labs.
Samples were collected at specified runoff locations; however, occasionally, clients would collect samples from non-designated discharge locations, from puddles after equipment passed through them, and stirred up sediments or from drains that commingled outside (street) runoff with the business’s runoff. Thus the ensemble of samples is virtually random in location and time. Moreover, we did not attempt to correlate our findings with weather and location. Our samples came from all of California’s watershed areas, each with its own microclimate, and consequently we had insufficient data points to compare by location or weather condition.
Power Law
The simplest and most appropriate description of a contaminant in the water is the power law, whereby the concentration of the contaminant decreases exponentially. We have computed this distribution for all the contaminants for the year 2013–2014.
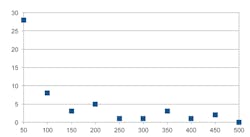
Figure 1 shows the distribution of TSS where the data is binned in 50-ppm bins over 12 bins covering a range of 1,800 ppm. We can see that the TSS, in ppm, falls off at the rate of -1.34. In this function, X is the bin number. The other properties of TSS are mean = 205 and median = 60 ppm.
This distribution is typical for all contaminants in this year and over the years. We know this because the mean and median values for all contaminants are mostly invariant over the 20 years of the data. Table 1 lists the values for these contaminants for the year 2013–2014.
All of these data used 59 samples for the distribution. For some, as with the TSS, there are one or more samples with an extreme value. Without loss in validity, they do not show up on the graph.
In Table 1, one can also note that the exponential for the falloff is quite consistent among the contaminants.
Trends in the Means and Medians
The pH sampling was essentially a Gaussian distribution, and the arithmetic mean equaled the median in those samples; moreover, the pH as measured in the laboratory might have aged over a day or two from its value when sampled in the field. Consequently this study does not include the pH measurements.
Except for pH, the contaminants showed a markedly skewed distribution, with the bulk of the measurements bunched up at low values, and a few had abnormally large values. These did not seem to correlate with facilities or locations but appeared at random throughout the samples. In all cases the mean value was larger than the median value. For most contaminants, there was a slight negative trend with time for both mean and median value. One might expect the median values to trend toward some asymptotic limit while the mean values would trend to the median values as an asymptotic limit.
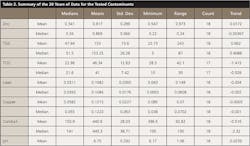
Table 2 sets forth the range of values in the measurements over the 20 years.
One can see some very consistent results in these data. The arithmetic mean is always significantly larger than the median values, except, of course, for pH. Moreover, the standard deviation for the median values is always smaller than the mean values, with one exception—conductivity. This is consistent with the observation that the trend over the years, while generally negative, is always smaller for the median.
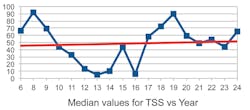
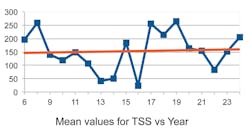
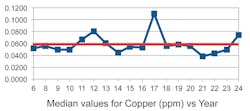
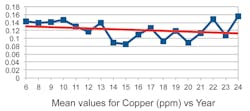
One unexpected observation was that the TSS, instead of being negative, was trending positive with the years. Moreover, the “trends” appear to be quite small, almost consistent with zero given the size of the standard deviation. In Figures 2 through 5 we show a couple of examples of the contaminants in ppm (TSS and copper) over an 18-year span. (Note that the first three years were combined into one.)
One can observe from these examples that the trends are small with considerable spread of values. Moreover, if the rather large value for the median in copper in year 17 were more in line with the average of the median values, the trend in copper would be close to zero.
Correlations
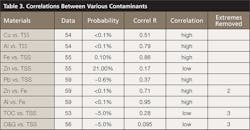
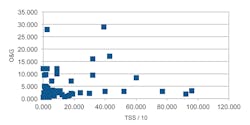
In reviewing the data, we asked ourselves whether there was any correlation between the contaminants. Some years ago, we did some laboratory studies that suggested a considerable degree of correlation between TSS and the other contaminants, heavy metals and TOC and O&G. Table 3 lists various correlations.
We computed the correlation using both the standard textbook form and the spreadsheet tools; the results were identical. The “Probability” is the inverse of the correlation: high probability is low correlation.
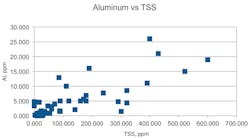
Table 3 shows some interesting observations: both TOC and O&G have low correlation with TSS, where we might have expected a high correlation. Also, zinc and iron and aluminum and iron were strongly correlated with each other and also with TSS. These correlations became more pronounced when we removed two or three extreme measurements of a contaminant. The scattering plots in Figures 6 and 7 illustrate these properties.
In preparing these correlations it was sometimes necessary to remove two or three measurements that were two or three standard deviations beyond the mean values. Removing two or three extreme values allowed us to look closely at the behavior of the bulk of the measurements, without loss of validity; otherwise the “extreme values” would distort the correlation and its interpretation.
Discussion
This study gives us insight into the form of and relations between the contaminants. Over the 20 years, there was no visible decrease in the contamination of stormwater from these facilities. The BMPs employed in this industry were passive. They included removing oils, coolant, and brake fluids from the vehicles for recycling. Drive train components were stored under cover, although often outside, and vehicles stored outside were blocked up off the dirt. Stormwater was sometimes filtered through straw bales or commercial absorbent socks. These BMPs are ineffective in reducing the median levels of the contaminants.
A study of Table 3 shows that most contaminants correlate well with TSS except for the organic carbon (TOC). We are surprised at this result because some simple laboratory tests we did early on suggested that the oil and grease ought to be well correlated with TSS, the concept being that oils and grease would cling to the neutral sand, dirt, and vegetation suspended in the stormwater runoff.
This heuristic study, however, makes a point about reduced O&G/TOC over time in samples and also points us in four directions when it comes controlling contamination in the stormwater:
- Continued diligence in cleaning up obvious spills and areas of obvious staining by leaking/dripping contaminants.
- Correctly taking samples at the designated location(s).
Removing TSS from the runoff. This will concomitantly remove a notable amount of heavy metal contaminants. Installing appropriate methods for trapping the suspended solids and sampling the water at the entrance and exit of the traps would provide a measure of the efficacy for removing contaminants from the stormwater. - At the end of the rainy season, gather up the residue, test it for contamination, and dispose of it according to its toxicity.
To illustrate the concept of capturing and the TSS we present a schematic description (Figure 8). Here the suspended solids are trapped in a settling basin and filtered; there may be multiple inputs to the trap or filters and one outflow. We show sampling at each of the inputs and a sample taken at the output. In general, for simplicity, it may be appropriate to combine the input samples into one, to save cost. The comparison of the input and output analyses will indicate the efficacy of the TSS trap and, when compared to the overall statistical analysis, reveal the level of correlation between the various contaminants.
From this one could craft additional cost-effective management practices targeted at specific contaminants. Finally, the sediment from the TSS trap should be tested for contamination to identify further the correlations and determine the disposal of the sediment. - Initiate research to ascertain further the relationships between the contaminants and to develop an active water-filtering media for heavy metals.
These management practices are intuitive and self-evident, although correlating TSS with other contaminants may not be obvious to the facility operator and will require additional training.
References
Taylor, J. R. 1982. An Introduction to Error Analysis: The Study of Uncertainties in Physical Measurements. University Science Books.
For separation of suspended solids, see for example: Minton, Gary R. “The Principles of Gravity Separation,” Parts 1, 2, and 3, Stormwater, October 2013, November/December 2013, and January/February 2014.
Acknowledgements
Donald Reh, vice president emeritus, NEST Environmental Services

