Constructed Wetlands to Reduce Nutrients From Runoff in Croplands
Wetlands have been shown to be an efficient way to remove nutrients and pesticides from cropland runoff. Appropriately positioned and sized wetlands can remove significant amounts of nutrients from agricultural runoff while restoring natural habitat and reducing flooding. Engineered treatment wetlands thus consist of a nature-based solution combined with an engineered solution. The topic of this article is the funding, design, construction, and operational characterization of a constructed wetland system constructed to mitigate nutrient release from drain tile runoff from marginal cropland as it relates to possible applications for urban stormwater runoff.
Background
Excessive nitrogen (N) and phosphorus (P) nutrient runoff from the Midwest region is a primary cause for the annual hypoxia “dead zone” in the Gulf of Mexico though the stimulation of algal growth. More locally, excessive nutrient releases can cause massive algal blooms in lakes throughout the region, as well as parts of the Great Lakes. Among the states contributing to Gulf of Mexico hypoxia, Indiana, Illinois, and Iowa contribute most nitrogen flowing into the Mississippi River.
Row-crop agriculture is one of the largest sources of nutrients by category within the Mississippi River Basin. This is particularly true for N, where agricultural sources account for up to 80% of the total load (urban sources account for the remainder). In response to the growing dead zone issue, the Gulf of Mexico Hypoxia Action Plan requires all Gulf watershed states to develop a plan to reduce nutrients by 45%. In 2015, Illinois enacted the Nutrient Loss Reduction Strategy to address point-source pollution, urban runoff, and agricultural runoff. Through the Illinois Council on Best Management Practices (BMPs), agricultural commodity groups and associations have developed the “What’s Your Strategy?” campaign, providing information on nutrient management and nutrient reduction practices. The focus of this strategy is not a single BMP, but a system of practices to achieve overall nutrient goals set by the state nutrient reduction strategy.
We have promoted wetlands for the treatment of cropland tile drainage as an essential part of the conservation practice toolkit to achieve the mandated nutrient reduction goals. Unlike other practices such as increased utilization of cover crops (the effects of which can be difficult to quantify), wetlands have a directly measurable resource conservation impact. Given their upfront cost and lack of visible economic benefit to the farmer, however, wetlands continue to be an underutilized practice compared to the potential. To date, relatively few wetland practices that specifically address subsurface tile drainage and water-quality improvement have been promulgated for entire state of Illinois, leaving a gap in water-quality improvement efforts.
Considerable research has shown that wetlands canbe effective in removing a wide variety of water-quality pollutants due to a combination of biological, chemical,and physical processes. Municipal and industrial waste-water treatment wetlands for secondary and tertiary treatment have been studied for more than 30 years, and in the last 10 years, wetlands for the treatment of agricultural runoff have been studied by Iowa State University, the University of Illinois, and The Nature Conservancy, among many others.
Using the Farmable Wetland Program under the US Department of Agriculture’s (USDA’s) Conservation Reserve Program (CP-39), the Wetlands Initiative has successfully facilitated the design and construction of a treatment wetland located on a private farm in north central Illinois. Two monitoring locations at the inflow and outflow allow for the measurement of nutrient concentrations throughout the growing seasons and periods of dormancy. The characterization of the constructed wetland is currently underway. Estimates of treatment potential can be made from the amount of nutrients contained in cropland runoff, rate of nutrient uptake within the constructed wetland, and removal rate efficiency resulting from the outflow.
Project Description
A subsurface tile drainage system was installed at the farm to remove excess water from the root zone within one to two days after a heavy rain. The tile drainage system also conveys soluble nitrate-N (NO3-N) away from the crop root zone and directly into West Big Bureau Creek. Using drain tile locations combined with landowner knowledge, an estimated tile drainage area of 40 acres is captured by the constructed wetland. Strategically placed, the wetland is located adjacent to the west bank of the creek, allowing the interception of tile main while minimizing the amount of farmland taken out of production. This existing 12-inch tile main was upgraded to a 15-inch tile and redirected into the wetland, which discharges to the creek. The constructed wetland is approximately 1 acre in size.
The wetland was constructed with upland berms such that there is limited or no overland flow from the adjacent farm fields to the wetland. Surface runoff from the larger 260-acre watershed continues to flow overland into the creek. Routing the larger tributary area through the wetland would require a larger footprint and subsequent resources to meet the requirements for funding of the project. A 108-foot buffer of prairie grasses and forbs surrounds the wetland on three sides.
According to the Federal Emergency Management Agency regulatory Flood Insurance Rate Map (FIRM) and USDA soil survey maps, the constructed wetland is located neither within the 100-year floodplain associated with the creek nor in any floodplain wetlands.
Design
The wetland was constructed in accordance with Natural Resources Conservation Service (NRCS) requirements for standard practice 656-Constructed Wetland, Cropland Drainage Water Treatment. Major stormwater design parameters include the following:
- Volume: 25-year, 24-hour design storm
- Emergency overflow: 25-year, 24-hour design storm (peak)
- Maximum residence flow: < 1.5 feet/second, 10-year, 24-hour design storm
- Draw down: 72 hours following 10-year, 24-hour design storm
The treatment pool design criterion is to be at least 1% of drainage area. The treatment pool is defined as the portion of the basin ranging from 2 feet below to 1 foot above the permanent or normal wetland pool elevation. The treatment pool consists of two zones where the area of the 0-to 1-foot increment above the normal water level is 60% of the treatment pool area and total surface area of the treatment pool (0 to 1.5 feet) is approximately 2% of the drain tile drainage area (40 acres). Where not land or cost prohibitive, for the most efficient nutrient removal, the treatment area would be closer to 2.5–5% of the drainage area. A treatment pool depth of 1.5 feet was chosen to ensure a shallow marsh system with emergent vegetation, which is key for nutrient removal. The emergency overflow is set 1.5 feet above the normal water level and the inflow pipe 0.5 foot above the normal water level.
Three interior berms or raised beds were added to force low flow to meander and extend the hydraulic distance from the inlet to the outlet. The peak flow rate from inlet to outlet is 0.0002 feet per second for the 10-year, 24-hour design storm.
A deep zone was constructed at the inlet to disperse the incoming pipe flow across the width of the wetland. The volume of the constructed wetland can accommodate a high sediment accretion rate of 1 inch per year for several years before increasing the normal water level, adjustable through water control structure at the outlet. The landowner has the ability to clean out the portions of the wetland if sediment accumulation and organic matter accretion affect the operation of the wetland. Existing soil conditions were clay with low plasticity, suitable for construction of the berms and wetland to retain water without the installation of a liner.
An HEC-HMS analysis was performed to demonstrate that the design met the required stormwater design standards. Table 1 summarizes the methods used for the HEC-HMS analysis as required by NRCS. The principal spillway (in-line water control structure with 15-inch-diameter pipe) alone can pass the peak discharge from the 10-year frequency, 24-hour duration storm event, and return to design operating levels within 72 hours after a 10-year frequency, 24-hour duration storm event. The peak elevation for the 25-year frequency, 24-hour duration storm event was lower than auxiliary spillway crest elevation (an 8-foot broad-crested earthen weir).
Construction
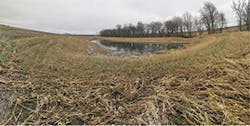
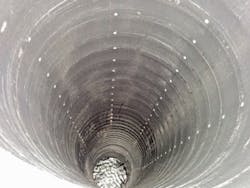
The constructed wetland was built over five days in August 2015 as part of a conservation and construction expo in partnership with the Illinois Land Improvement Contractor Association. Normally, wetland construction would take two to three weeks depending on weather and soil saturation conditions. Because the tile drains are located 3.5 to 4.5 feet underground, extensive excavation was necessary not only to expose the intercepted tile but also to allow another 3 feet of depth for placement of the growth media (1 foot of topsoil) and for the normal water elevation to be 0.5 foot under the inlet pipe invert. However, with gentle side slopes, a wide berm, and emergent vegetation, the wetland will not look like a control basin or a farm pond. Key components of construction include the 15-inch-diameter inlet and outlet pipes (solid PVC), 5-foot-tall water control structure at the outlet, anti-seep collars on the outlet pipe to prevent any instability in the backfill around the pipe, and a solid keyed-in clay berm and wetland bottom to prevent any leaking or berm failure. Construction was completed in fall 2016, and cover plantings were established by December 2015 (Figure 1).
Data Collection
While wetlands’ overall nutrient removal capability has been demonstrated through many studies, a knowledge gap exists as to the exact processes of how and where N and P removal is achieved in agriculture tile treatment wetlands and wetland buffer areas. Multiple techniques for data collection are needed to elucidate the exact mechanisms of nutrient capture, both to optimize the nutrient removal process and to facilitate development of a protocol for measuring this nutrient removal most effectively and cost effectively.
Information gained through structured water-quality monitoring of the wetland will provide key evidence for other farmers that these wetlands are effective at removing nutrients. At the same time, this monitoring will elucidate the precise processes by which constructed wetlands and their buffer areas remove nutrients, filling a knowledge gap. This more detailed understanding of the wetlands’ function and how nitrogen and phosphorus move through the system can be used to further enhance the design of constructed wetlands to achieve maximum nutrient removal.
Performance Monitoring
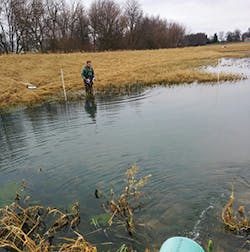
Routine wetland samples were obtained from automated sampling stations at the inlet and outlet structures (Figure 2) at one-time-per-day intervals using an Isco automated sampling unit. Samples (250 milliliters) were collected and preserved with H2SO4 using Standard Methods. Samples were also obtained to determine spatial variability by grab sampling with a 1-liter Nalgene sample bottle at locations within the wetland cell, as well as locations upstream and downstream of the treatment cell outlet on an ad hoc basis.
Samples were analyzed for various nutrients including total N (TN), NO3-N, ammonia-N (NH3-N), total P (TP), and soluble reactive P (SRP) using Standard Methods. In addition, bulk physical and chemical characteristics were measured including pH, conductivity, dissolved solids, and alkalinity using Standard Methods.
Hydraulic Characterization
A tracer study was performed to characterize the hydraulic behavior of the wetland using a conservative tracer (bromide) injected in the inlet and measured at the midpoint and outlet of the treatment cell. Bromide was usually not detectable in water samples (measured by ion chromatography) so it was used as the conservative tracer for this study. Samples were measured over the course of two days, and the resulting breakthrough curves were used to determine residence time and to investigate short-circuiting and other non-ideal hydraulic behavior.
Wetland Characterization and Results
Construction of the wetland was complete by November 2015, and we obtained preliminary samples in December 2015 prior to the winter freeze when the autosamplers cannot be used. Results show that both ammonia-N and TP are lower (but not significantly) in and through the wetland compared to the receiving stream (Table 2). However, the upstream water has a higher conductivity, alkalinity, and pH compared to the wetland effluent, resulting in lower levels downstream following mixing with the wetland effluent.
There were no statistically significant differences in any water-quality parameters between the wetland inlet and outlet. We expected as conditions changed in the spring that we would observe higher nutrient levels in the inlet to the pond as farm operations commenced coupled with the spring thaw as baseline flow in the tile system increased.
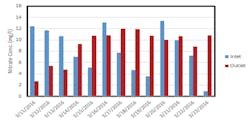
Following the spring thaw, water levels increased as precipitation events increased baseline flow in the system (Figure 3). Nitrate concentrations in the influent were typically in the 4- to 12-mg N/L range as sampling commenced in March 2016 (Figure 4). Nitrate removal was not high during this period as the system developed during the spring.
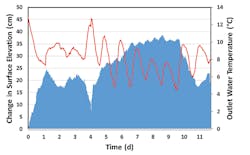
To determine the effect of varying water levels on nitrate removal, the weir outlet elevation was increased on March 11, 2016. This led to increasing water depth in the wetland, up to 40 centimeters (about 1.5 feet) within a period of 10 days (Figure 5). As shown in Figure 5, nitrate removal decreased substantially from 60 to 80% removal during the initial period from March 11 to March 13, to no removal after five days. While we might conclude that nitrate removal requires shallower water depth in the wetland, it is too soon to draw these conclusions as the system has just started to develop the necessary conditions for effective nitrate removal, which will be established as the wetland plants grow and develop.
Interestingly, soluble reactive phosphorus (SRP) removal was still relatively high during this time period and did not appear to be affected by changing water levels in the treatment cell (Figure 6). There may have been some effect of changing temperatures in the system, as temperatures increased (Figure 5) concomitant with an increase in removal efficiency (Figure 6). Note also the clearly observable 2–4°C (35.6–39.2°F) diurnal temperature variation in the system between nighttime lows and afternoon highs (Figure 5).
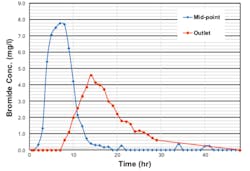
The tracer study was performed in April 2016. A bromide (Br-) tracer was injected into the inlet control structure for a period of six hours. Samples were obtained at five-minute intervals for conductivity and at one-hour intervals for Br- measurement in the laboratory by ion chromatography at the wetland cell midpoint and the outlet control structure. The breakthrough curve does not suggest substantial short-circuiting of the system, but it does indicate substantial dispersion (Figure 7). There is clear peak tailing in the outlet tracer. Overall recovery of the tracer was nearly 90%, indicating a high degree of recover. The first and second moments of the breakthrough curve were determined to arrive at a hydraulic residence time of 17.5 ± 6.7 hours. This is less than would be expected to occur during summer months, due to the unusually wet spring. We speculate that this relatively short residence time also may impact nitrate levels in the influent, and likely may have negatively impacted nitrate removal efficiency as shown in Figure 4. A similar study will be performed after the wetland cell has established emergent vegetation to investigate the effects on hydraulic behavior in the system.
Constructed Wetlands in Urban Settings: Stormwater Management
Pollution from excessive nutrient applications is well documented and a common occurrence in urbanized areas. While the scale of excess nutrient loading from urban areas (nutrient application for turf and landscape vegetation) is small compared to agricultural use in some regions, the effect of excess nutrients on stormwater management facilities and downstream receiving waters is the same. This is true in urbanized areas across the country. Two regions of note include the Great Lakes region watersheds (Lake Erie) and the Chesapeake Bay watershed. According to EPA, urban and suburban stormwater is the source of about 15% of the total nitrogen entering the Chesapeake Bay, and it is the only source that is still increasing. In some rivers it makes up an even higher percentage of the problem. Agriculture and sewage treatment plants are responsible for greater percentages of pollution; however, regulations on these sources have made progress toward reducing nutrient inflow.
Over the last 40 years, the onset of stormwater regulations has targeted rate control of stormwater runoff to help offset land-use changes as a result of new development, and rate control is now widely adopted as regulatory. These earlier regulations have become regulatory for local communities and agencies, with only the recent onset of volume control becoming regulatory in the 2000s. The development of a volume control standard requires new developments and redevelopments to capture a portion of stormwater runoff and retain it onsite, allowing infiltration, evapotranspiration, or slow release into a minor system to reduce site runoff volume. This standard provides a surrogate for pollutant removal in runoff from the first flush through filtration, absorption, and biological uptake onsite. The volume control requirement is designed to target storm events occurring most frequently, often the first 1 inch of rainfall during a storm event.
Projected removal rates of nutrients have been widely studied, and the efficiency of various BMPs is largely reported as a percent removed. This is true from a design perspective, as most ordinances require a system of BMPs based on a percent removal rate for a constituent of concern. As this study continues to move forward, the characterization and removal rates determined for the constructed wetland can be used to bolster nutrient management plans for both application rates and timing as well as to document the efficiency of this well-known BMP. The results of this study can be compared to nutrient concentrations in runoff from a typical residential subdivision or urbanized area to suggest the efficiency of a constructed wetland over the course of multiple growing seasons.
Implications for Stormwater Regulations
Stormwater quality is gaining increasing traction on local, state, and national levels. The Illinois Environmental Protection Agency (IEPA) issued the new National Pollutant Discharge Elimination System permit (NPDES ILR 40) for discharges of small municipal separate storm sewer systems (MS4s) on February 10, 2016. The recently enacted MS4 requirements include the development and implementation of a monitoring and assessment program. The monitoring program does not indicate particular constituents of concern or appropriate levels at this time. The enactment of a monitoring program does suggest the potential creation of threshold levels in the future for those constituents being monitored by each community within a particular region. Receiving streams without an identified total maximum daily load (TMDL) for a particular constituent may be subject to performance requirements identified in the early monitoring stage. In the future, performance requirements identified through monitoring programs must be met through stormwater control measures. This will require monitoring stormwater volume and pollutant load reduction of post-construction best management practices. The information collected in this study will be helpful during the decision-making process for constructed wetlands compared to other BMP selections and performance.
Stormwater quality management is an increasingly necessary and expensive regulation for local municipalities to meet when considering performance evaluation and long-term maintenance. The constructed wetland has shown to be most reliable with respect to overall performance; however, long-term maintenance must be considered. As a wetland matures and vegetation becomes well established, phosphorus removal may be significant during initial establishment period as the plant community has high demand for nutrients. However, as the wetland undergoes the natural growth-death-growth cycle through the winter months, the removal efficiency may begin to decline. New growth will begin to use remnant organic material for nutrient uptake rather than nutrients from the stormwater inflow. Without harvesting or physical removal of organic material from the system, the efficiency of the system will be reduced. A long-term maintenance plan including sediment removal, trimming, and burning or removal of vegetation is required, as well as subsequent funding. The data collected during this study will include the long-term maintenance requirements and level of effort required to achieve optimal removal rates from the system.
Summary
Using the Farmable Wetland Program under USDA’s Conservation Reserve Program (CP-39), the Wetlands Initiative has successfully facilitated the design and construction of a constructed wetland located on a private farm in north central Illinois. Two monitoring locations at the inflow and outflow allow for the measurement of nutrient concentrations throughout the growing seasons and periods of dormancy. The characterization of the constructed wetland is currently underway. As the project team continues to collect data and monitor the system function, modifications will be made to stabilize the residence time of the system. While we might conclude that nitrate removal requires shallower water depth in the wetland from the initial results, it is too soon to draw these conclusions as the system has just started to develop the necessary conditions for effective nitrate removal which will be established as the wetland plants grow and develop.


