At the western base of Utah’s Wasatch Mountains, a narrow urban strip approximately 120 miles long and 6 miles wide is home to 80% of the state’s population. Known as the Wasatch Front, this linear metropolis includes Provo, Ogden, Salt Lake City, and scores of smaller towns and cities, with a total population over two million.
Managing water resources along the Wasatch Front has long been a challenge. Since pioneer settlement in the 1840s, water has nonetheless sustained its large population and productive agriculture. In a climate characterized by cold, snowy winters and hot, arid summers, water is of perennial interest. Reservoirs perched high in the mountains capture snowmelt each spring and help supply water through the summer and fall. Streams and ditches crisscross the valleys and pass through neighborhoods, parks, and commercial districts. Ongoing land development requires larger withdrawals from surface water and groundwater, while growing wastewater and stormwater discharges threaten water quality in fisheries and recreation areas. Dealing with the Wasatch Front’s water issues has become particularly complicated in recent years as stakeholders work to manage water across civic, hydrologic, and topographic boundaries.
The Need for Data
A major resource to help manage water in Utah is the state’s Automated Geographic Reference Center (AGRC), which maintains an online repository of spatial data for mapping and GIS. One important category is elevation and terrain data, usually in the form of digital elevation models (DEMs). Much of the data is based on LiDAR technology.
LiDAR is a remote-sensing technology similar to radar. A hybrid of “light” and “radar,” it is also written lidar, Lidar, or LIDAR since consensus on its status as a word or acronym is yet to be reached. While radar uses radio waves, LiDAR measures distance and color by illuminating a target with infrared laser pulses—up to 150,000 per second—and analyzing the reflected signal. LiDAR technology was developed soon after lasers in the 1960s, and now its decreasing costs and higher precision are making it more appealing for a variety of uses from military and transportation, to meteorology and agriculture. LiDAR can be stationary (ground-based) or airborne with aircraft-mounted equipment. Airborne LiDAR surveys provide continuous coverage over all types of terrain and large areas.
Previous AGRC projects in 2006 and 2011 captured LiDAR data at 6.6- and 3.3-foot horizontal resolution in parts of northern Utah. Still, no complete dataset of sufficient detail was available for the entire Wasatch Front, where robust data were needed most.
Tarin Lewis, a project manager at Quantum Spatial (formerly Watershed Sciences Inc.) in Portland, OR, agrees that finer data were needed. The previous dataset was valuable, she says, “but there is a limitation for further analysis.”
A new, more detailed LiDAR project would benefit several users, says AGRC’s Rick Kelson. The Utah Geological Survey and US Geological Survey (USGS) were interested in mapping geologic hazards, particularly the Wasatch Fault, before they are built over. The Utah Division of Emergency Management and the Federal Emergency Management Agency (FEMA) needed information for their Risk Mapping, Assessment, and Planning program. The USGS wanted to update its 3D Elevation Program and The National Map. Surveyors, planners, researchers, and developers were interested in updated topography, as were the Salt Lake County Surveyor’s Office and partner cities. Water engineers and utility professionals were also eager to use the data, which would be free to the public.
“There is a strong trend towards mapping our current environment as accurately as possible in order to better understand how potential future changes will impact our lives and natural resources,” says Lewis. “It was great to see a large group of stakeholders come together to fund such a project and decide to offer the data publicly.”
During 2013 and 2014, AGRC undertook an ambitious program to collect high-resolution surface data along the Wasatch Front. With the support of the aforementioned partners and Quantum Spatial, AGRC acquired 1,422 square miles of surface data with airborne LiDAR. The project covered Salt Lake Valley, Utah Valley, and additional areas along the Wasatch Fault from Gunnison, UT, to Malad City, ID.
USGS conducted quality control before the data were published in September 2014. The purpose of this process was to ensure that the data sets met rigorous standards and were of sufficient quality for public access and scientific analysis. “Data acquisition, and all derivative products, met or exceeded all specifications,” the project’s final report says.
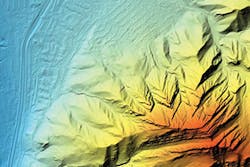
Available products include bare-earth DEMs, first-return digital surface models (DSMs, which include buildings and trees), intensity rasters, and laser point clouds. DEMs and DSMs have a 1.6-foot horizontal resolution and 2.5-inch vertical accuracy when compared with ground control surveys. Derivative datasets such as contours, hillshades, and slopes can be generated with GIS or CAD software.
The new data would be “put to work for a diverse set of uses,” an AGRC news release predicted, including “modernization of flood hazard maps, fault studies, transportation project design, infrastructure mapping, solar energy quantification, and tree and vegetation studies.”
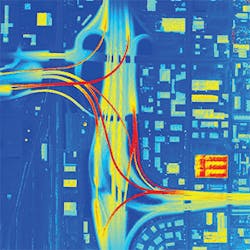
First-return digital surface model
(DSM) of I-15/I-80/SR-201 interchange in Salt Lake City
Applications in Water Resources
Among LiDAR’s capabilities are many applications for water resources, as users of Utah’s new data have discovered. The data inform the planning, design, construction, and operation of various water-related projects.
Lewis has observed several applications. “We’re seeing a huge increase in data being collected and used for updating floodplain maps, coastal changes, riparian conditions, and post-natural disaster changes for both natural and urban environments,” she says.
One example is stormwater. Utah engineers and utility professionals have used the new topographic data to determine drainage paths, identify flow barriers, and delineate watersheds. The data have been especially useful in urban areas, where the topography has been most altered and the most runoff occurs. LiDAR detail is sufficient to capture curbs, driveways, channels, depressions, and other features affecting drainage, which may have been overlooked before. Hydrologists and engineers can more accurately model how stormwater will drain from the surface into a city’s collection system. This application has led to reduced surveying and data collection costs for several utilities, as well as better assessments of downstream impacts and system capacity.
Bob Thompson, a watershed scientist with the Salt Lake County Watershed Planning and Restoration Program, explains how his department uses Utah’s new LiDAR data. “LiDAR can help us eliminate much of the background survey needed to design stream restoration projects,” he says. “The resolution is so much better than the 2006 LiDAR we were previously using. I have used LiDAR to spot-check surveyed elevations and create a [computerized] surface for a conceptual design.”
Thompson observes that LiDAR penetrates most vegetative cover and helps him characterize features not visible in aerial photography. “I have used LiDAR-based terrain to map stream channels where vegetation in aerial photos hides the stream channel,” says Thompson.
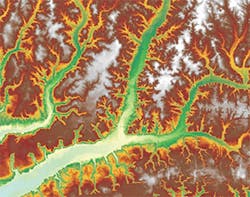
Riverine and floodplain models have been developed from the data since stream networks and grade breaks are apparent, especially with visualization tools. From the DEMs, engineers can extract stream profiles and floodplain cross-sections for one- and two-dimensional hydraulic analysis. The same information helps delineate floodplains and assess risks of flooding to life and property depending on the extent of a given flood scenario. One analysis for a portion of northern Utah indicated new areas that would be inundated in a 100-year flood. It also helped the local authority know what infrastructure should be constructed or upgraded to handle the associated flows and reduce the potential damage.
Natural River and Stream Channels Identified From DEM
LiDAR has also assisted with site selection. In one case, a city needed to locate a site for a new 6-million-gallon water tank. Criteria included a parcel size of at least 3.7 acres to accommodate construction without excessive cut/fill or shoring requirements; preferably undeveloped land to avoid conflicts with constructed properties; elevation between 4,700 and 4,720 feet to match the intended pressure zone; and slopes less than 20% to ensure stability and access.
AGRC’s LiDAR data helped the city quickly narrow the list of eligible sites. Parcel data provided the shape and area, a DEM indicated the elevation, a derived slope raster gave the slope, and LiDAR intensity raster helped distinguish developed and undeveloped land. GIS tools streamlined the criteria evaluation and produced a summary of the eligible sites’ metrics. Engineers then examined aerial photography and other datasets to assess suitability before visiting short-listed sites in person.
When a tank site was chosen, initial planning and design relied on topography captured with LiDAR. With elevations recorded every 1.6 feet in a DEM, the site was characterized by over 70,000 points—detailed enough to substitute for expensive and time-consuming field topographic surveys in the early stages. Like Thompson’s application for stream projects, the DEM helped engineers prepare conceptual plans for the tank site and for new transmission lines to and from the tank, before proceeding with preliminary and final design.
Water system models and inventories have benefited from AGRC’s LiDAR project. When hydraulic models and early system inventories were originally developed, some relied on intermittent or inconsistent data patched together from outdated maps or operators’ recollections. The new data—continuous and accurate along the Wasatch Front, where many large systems are located—allow engineers and utility crews to verify or update elevations attached to pipes, meters, tanks, and other features in computer models and inventories. Databases for drinking water, secondary water, stormwater, and wastewater systems have been updated with the new data to provide better accuracy and consistency.
While reliable elevation data are welcome, other useful LiDAR products are available. Kelson emphasizes how the data include more than just elevation.
“The majority of people simply use the bare-earth DEMs to generate contours and topography,” he says. “But there is a wealth of information available in the first-return DSMs and point clouds.”
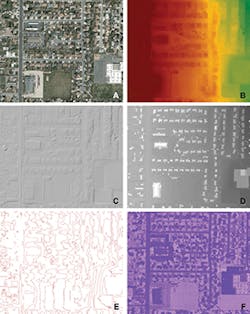
LiDAR intensity, for example, which is collected with each LiDAR scan, has helped users identify impervious surfaces along the Wasatch Front. Intensity indicates the strength of the return pulse based on the reflectivity of the struck object. Roads, driveways, parking lots, buildings, and water bodies are easily distinguished from lawns, fields, and bare earth when examining an intensity raster. Such data may become the basis for assessing stormwater service fees based on impervious area.
photography (A), bare-earth DEM (B), hillshaded DEM (C),
first-return DSM (D), contours (E), and intensity (F)
“LiDAR intensity is underutilized and can be used to quickly assess permeability or impermeability of an area,” adds Kelson.
Lewis explains that investing in high-quality data is especially wise if the data can be used for multiple purposes. “LiDAR data has so many uses that when you’re planning a project it’s important to keep in mind what you may need the data for in the future,” she says. For instance, if certain modeling or analysis could be necessary later, “it may be worth collecting an even higher-resolution dataset right from the start to save time and costs.”
Casey Francis of Aero-Graphics in Salt Lake City confirmed that traditional LiDAR is being used in stormwater, floodplain, and watershed applications. LiDAR, he says, is “the most accurate, efficient, and cost-effective survey method for capturing and modeling complex hydrological systems.”
One limitation of standard LiDAR is its inability to penetrate a water surface to capture features beneath. However, a more specialized technology called bathymetric LiDAR operates at a different wavelength (in the green spectrum) and is able to seamlessly map the underlying bathymetry of river channels, lakes, and other shallow waters.
“This technology has huge implications for civil engineering, habitat analysis, and natural resource planning,” says Lewis. “We’re excited about the increased interest in this technology over the past year, and don’t expect it to slow down any time soon.”
Beyond Utah
Utah is not alone in its embrace of LiDAR for water resources management. The Northwest Florida Water Management District, charged with responsibilities for water supply, water quality, flood control, and ecological protection in Florida’s Panhandle, needed better topographic information to fulfill its mission.
Like Utah, the district partnered with other agencies to fund a comprehensive LiDAR project and share the data publicly. “The need to develop accurate flood maps for the Panhandle led to the district working with FEMA and the Florida Division of Emergency Management to acquire funding for the use of LiDAR technology,” says communications director Jim Lamar. The USGS and local communities also contributed.
Topography in the Panhandle is complicated by many rivers, wetlands, and coastal marshes, plus developed cities and infrastructure. The district considered the LiDAR project a priority for managing water resources there. Lamar says that the district aimed “to not only create updated and more accurate flood maps but also obtain more detailed topographic and elevation data for all of our jurisdiction in northwest Florida.”
After data collection, the district developed an online mapping system to deliver the topography, imagery, and other geospatial information to the public. “The primary focus was the ease of use and access to the imagery as well as the ability to create maps through GIS and Web-based platforms,” says Lamar.
The district completed the project in 2011 and continues to benefit from the high-quality data it produced. “The district uses LiDAR data as the starting point for a variety of projects,” explains Lamar, “including hazard-mitigation planning and the implementation of mitigation projects, emergency response planning, recovery and redevelopment projects, hydrologic and hydraulic projects, stormwater master planning, and other environmental planning and analysis projects.”
Another organization that has put LiDAR to good use is the Minnesota Pollution Control Agency (MPCA), which used LiDAR in a statewide watercourse inventory completed in 2013. Over 160 years of development in Minnesota had modified, rerouted, or even created many watercourses, but the extent of the alterations was unknown. Monitoring and managing these resources was difficult without adequate information.
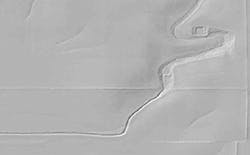
LiDAR hillshade of an unnamed Minnesota stream.
Note the change in width and sinuosity from top to bottom.
“The State of Minnesota did not have a thorough accounting of streams that have been altered,” says MPCA research scientist Benjamin Lundeen. Prior to the project, MPCA staff used several tactics to determine whether a stream was altered. The process was subjective, time consuming, and produced inconsistent results.
The MPCA wanted to catalog all watercourses in the state and reliably determine which ones were natural or altered, but sending field crews to inspect all 105,000 stream miles was impractical. Instead, the MPCA partnered with the Minnesota Geospatial Information Office (MnGeo) to leverage new GIS and LiDAR capabilities.
The team first undertook a pilot project in three watersheds to assess the feasibility of using geospatial resources to complete the proposed inventory. The pilot project produced new reference data, GIS workflows, and a successful methodology. The full-scale project began in 2011.
“The objectives of the Altered-Watercourse Project were to develop a GIS-based methodology for determining stream channel alteration, which focused on visual interpretation of contemporary and historic aerial imagery, including LiDAR, as well as several other reference layers,” says Lundeen. “This methodology was used to review all of the national hydrography stream linework within the State of Minnesota.”
Statewide LiDAR coverage at 3.3-foot horizontal resolution proved to be indispensable in the process. “LiDAR was used to determine whether a particular stream had ever been altered,” explains Lundeen. “There are often telltale signs of alteration, such as soil piles or evidence of the old channel. This was also used to determine whether a stream would actually have water in the channel throughout the year. LiDAR data also provided visual evidence of old channels that were cut off as part of the alteration event.”
Among other criteria, LiDAR helped detect changes in channel width and sinuosity—a river’s natural S-shape. A straight, narrow, or otherwise unnatural shape was one indicator of an altered watercourse. The project concluded that 50% of Minnesota’s watercourses were altered. Each watercourse was categorized as altered, natural, impounded, or indefinable.
Minnesota agencies have found several uses of LiDAR beyond the Altered-Watercourse Project. LiDAR has supported erosion analysis, wetland mapping, flood control, and siting of best management practices. The MnGeo expects the uses to increase exponentially as LiDAR data become available for more areas of the state. The MPCA also expects increased use. “We anticipate a growing use of LiDAR dataset within the MPCA’s continued water quality and assessment work,” says Lundeen.
Looking Forward
Utah’s 2013–2014 LiDAR project has found a variety of uses, especially in the local water industry. The effort has produced consistent, detailed spatial information where it is needed most. The new public datasets are “available for city planners, public utilities, nonprofit organizations, students, and anyone else who is interested,” says Lewis, and have already aided management of water resources in the state’s most populated area.
LiDAR has many other potential uses, says Kelson.
“Some of these include vegetation metrics, canopy assessment, height-above-ground measurements, solar potential, line of sight, infrastructure delineation, and feature extraction.”
Further applications include detection of faults and landslides and delineation of building footprints, wetlands, and floodplains. With the data in the hands of innovative users, the possibilities are limitless.
“There are new applications for LiDAR data just waiting to be found,” says Lewis. “It would be great to see this dataset be a part of the next discovery.”
