Implementing green, gray, and watershed-wide stormwater solutions in the Broad Meadow Brook Watershed
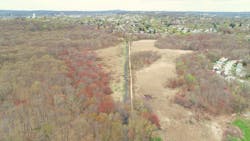
The 435-acre Broad Meadow Brook Wildlife Sanctuary (Figure 1), the largest urban wildlife sanctuary in the southeast corner of Worcester, Massachusetts, is in an urbanized landscape. The sanctuary is a partnership between the City of Worcester, National Grid, and the Massachusetts Audubon Society (Mass Audubon).
The sanctuary has its challenges, including flooding in nearby low-lying neighborhoods and invasive plant species. The brook is isolated from part of its floodplain by an earthen embankment that contained a sewer force main. When the city decommissioned that force main to improve its wastewater treatment system, Mass Audubon, along with the city and the Massachusetts Division of Ecological Restoration (MA DER), initiated a restoration program.
Weston & Sampson developed a hydrologic model of the brook’s watershed to understand runoff patterns and identify design flows. The effort included a hydraulic model of the brook and its floodplain to support stream restoration design alternatives, green and gray infrastructure solutions, and watershed-wide strategies to reduce urban runoff under various climate scenarios, while also improving water quality.
Watershed model development
The team updated the hydrologic model, which had been initially developed to identify design flows for the planned stream restoration project. The watershed model was developed using PCSWMM, a software package that combines the EPA’s SWMM methodology for estimating runoff rates from pervious and impervious surfaces containing piped stormwater systems with a 2D mesh for evaluating surface flooding and flow paths. This model was developed with a combination of publicly available datasets like soil type and LiDAR, with GIS of existing stormwater infrastructure provided by the city, along with field investigations to fill in remaining data gaps.
The model was calibrated with water level data collected using automated monitoring equipment in a city manhole adjacent to the sanctuary. This data was supplemented with continuous water level and streamflow data recorded by MA DER in the downstream Broad Meadow Brook channel. Multiple model input parameters were iteratively modified until the simulated model flow depths and runoff rates reasonably matched historical observations.
Existing conditions results
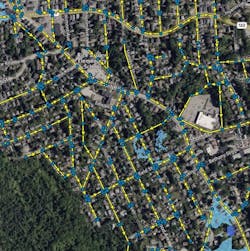
The model was used to simulate flooding conditions under present and future climate scenarios and identify a baseline to compare the effectiveness of mitigation strategies and individual green and/or gray solutions. Then, it was used to evaluate flooding in terms of peak discharge and total runoff volume arriving in the sanctuary, as well as in terms of the depths, and volume of flooding within the watershed’s neighborhoods and streets (Figure 2). Flooding ranged from half an acre to over 12 acres during simulated 24-hour design storms ranging from the 2- to the 100-year events. Shorter (i.e., 6-hour) duration events with greater peak rainfall intensity produced simulated flooding from 15 to 20 acres. That pattern is expected to continue under a 2070 climate scenario, with flooding extents ranging from two acres to about 25 acres during 24-hour events and more than 30 acres during the shorter, higher intensity events.
Watershed-related benefits
Based on these findings, the project team evaluated anticipated flood reduction benefits of three different watershed-wide mitigation strategies. Those strategies are to:
- Implement the equivalent of 1 inch of storage for all impervious surfaces within the watershed, consistent with Massachusetts Stormwater Water Quality Standards.
- Reduce impervious surface cover throughout the watershed by 10%. The current average percent impervious within the sub-catchments draining to the project area is on the order of 50 to 55%.
- A combination of 1 and 2.
As expected, the combination of increasing impervious runoff storage using techniques such as subsurface chambers, along with reducing the impervious surface cover, provided the largest benefits. However, model results indicate that due to soil conditions that may limit infiltration, increased storage was significantly more effective than impervious cover reductions. The largest reduction in peak and total runoff for all three strategies is experienced during the short-duration, high-intensity events to which this watershed appears vulnerable.
Gray infrastructure opportunities
The team evaluated five gray infrastructure options that fell into two categories. The first category consisted of capturing runoff from sub-catchments within the watershed and redirecting small to moderate event runoff with in-manhole diversion weirs away from neighborhoods that are prone to nuisance flooding, discharging to other existing outfalls. The second type of gray infrastructure option consisted of the construction of additional relief drains in those neighborhoods. While model simulations confirmed modest reductions in flooding in those neighborhoods, some of the gray infrastructure options increased the peak discharge rate to the sanctuary. No options addressed increased upland flooding under climate change scenarios or provided a meaningful benefit to water quality or other co-benefits.
Green infrastructure benefits
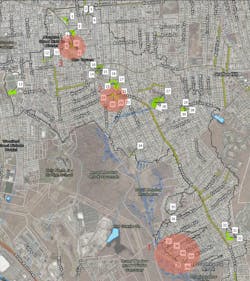
The watershed was assessed for implementing green infrastructure. Sixteen sites were identified as being good opportunities due to available space, land ownership and proximity to flooding. Within those sites, the team outlined 42 green infrastructure opportunities (Figure 3) of four main types: subsurface infiltration chambers, bioretention basins, porous pavement and de-paving. For each concept, estimates for reductions in impervious cover and increases in stormwater runoff capture and storage were made based on the type of green infrastructure incorporated and its approximate footprint. The model reflected these proposed conditions across a range of design storms to understand their capacity to reduce total runoff from the watershed and potential to reduce flooding impacts.
The model showed the green infrastructure opportunities have varied capacity to reduce runoff from their drainage areas, ranging from less than 1% to more than 75%. When all opportunities are simulated together, their ability to reduce peak runoff rates to Broad Meadow Brook are modest, approximately 2.7% and 2.0% during the 2- and 10-year storm events respectively. Reductions in total runoff are more significant, approximately 7.4% and 4.3%, respectively, during the same events.
Both flood reduction benefits and environmental/societal co-benefits were factored in to develop a prioritized list of solutions. The green infrastructure opportunities were ranked by their individual percent runoff reduction within their immediate drainage area. Each location and opportunity for the presence of priority environmental justice populations was assessed, as well as the ability of the proposed green infrastructure to reduce urban heat island effect, improve walkability, and provide ecological benefits to the surrounding area.
|
Green Infrastructure Prioritization Matrix Methodology |
||||
|
INDICATOR |
Scoring |
|||
|
3 |
2 |
1 |
||
|
Flood Reduction Benefit |
H&H Performance |
Flood Reduction Benefits: Significant |
Flood Reduction Benefits: Moderate |
Flood Reduction Benefits: Minimal |
|
Water Quality Performance |
Bioretention |
Subsurface Infiltration and Porous Pave |
Depave |
|
|
Feasibility |
Permitting Level of Effort / Presence of Resource Area |
No Permitting / NOI Necessary |
AE Flood Zone / Ch. 97 – reasonable permitting required |
Resource Area – extensive permitting required |
|
Ease of Implementation: Land Ownership |
City-owned land or right-of-way |
City-affiliated ownership such as Worcester Housing Authority |
Private Property Owner |
|
|
Operations and Maintenance (labor, equipment, cost) |
Bioretention and Depaving |
- |
Subsurface Infiltration and Porous Pave |
|
|
Cost of Implementation |
Depaving |
Bioretention Basin |
Subsurface Infiltration and Porous Pave |
|
|
Feasibility of Implementation (W&S Best Professional Judgment) |
Highly Implementable |
Moderately Implementable |
Barriers to Implementation Identified |
|
|
Co-Benefit |
Environmental Justice Neighborhood |
Two Criteria |
One Criteria |
No Criteria |
|
Reduction of Urban Heat / Pedestrian Improvements |
Bioretention and Depaving |
- |
Subsurface Infiltration and Porous Pave |
|
|
Biodiversity / Habitat |
Bioretention |
Depaving |
Subsurface Infiltration and Porous Pave |
|
Summary
The strength of green infrastructure lies in its co-benefits and ability to reduce nuisance flooding on a local scale. A combination of gray and green solutions will be required to comprehensively address flooding. The prioritization process resulted in a list of the top 10 green infrastructure concepts across the watershed the city can refer to as it moves forward in its work to reduce flooding and increase climate resilience.
About the Author
Kylie Tardif
Kylie Tardif is a water resources engineer for Weston & Sampson in their Rocky Hill, Connecticut office.
Doris Jenkins
Doris Jenkins, PE, LEED GA, is a project engineer with Weston & Sampson in their Reading, Massachusetts office.
Alex Simpson
Alex Simpson is a senior project engineer at Weston and Sampson.


