First came Global Positioning System (GPS) technology, which helps answers the question: Where? Where are the BMPs on a specific construction site? Where are the dams or the riparian buffers on a farm, or the toes and the tops of bluffs?
Then came geographic information systems (GIS). With GIS, users can collect and store data of all kinds: topographical maps, aerial photographs, and satellite images; data that has been remotely sensed, for example, by cameras, digital scanners, and LIDAR (light detection and ranging); and data from GPS devices and from the field, such as climate, topography, soils, vegetation, and land use. Each of the datasets in GIS can be linked with any of the others.
Beyond that, though, programmers can use GIS software to create models to analyze and solve problems. These models are a combination of data, the accuracy of which is crucial to the models, and mathematical equations and parameters. The results are displayed in a way that is easy to visualize and share, often as reports, maps, charts, or tables.
GIS models show patterns, relationships, and trends and can help to answer such questions as, How effective are the BMPs on the construction site? Would the installation of BMPs on the farm reduce sedimentation and nutrient loading, not only in nearby waterways but also in the entire watershed? By how much? Which ones would be the most efficient? How much erosion has taken place on the bluff in the past 40 years, and how much will take place in the next 40 if no steps are taken?
An exciting innovation combines GIS with 3D technology and animation, giving users the most remarkable visualization tool yet: the ability to visualize a process, such as the erosion of a bluff, over a period of many years on a computer screen.
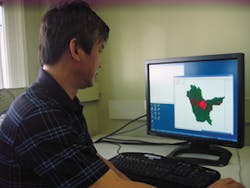
South Tobacco Creek Watershed
For decades, some farmers in Canada and the US have been using best management practices (BMPs) to improve the quality of the water leaving their farms. Their performance has been tested at selected locations at nearby streams, rivers, and lakes, but it has been too expensive and time-consuming to test them at the watershed level. Until recently.
The Watershed Evaluation of Beneficial Management Practices (WEBs) project in Canada is conducting biophysical, hydrologic, economic, and integrated studies to evaluate the effects of specific BMPs on nine watersheds across the country.
“Agricultural areas have a very important impact on the water quality of streams and lakes,” says Dr. Yongbo Liu of the University of Guelph in Ontario, who is co-leading the modeling project at the South Tobacco Creek (STC) watershed in Southern Manitoba with Dr. Wanhong Yang, also of Guelph. “If there were no BMPs, there would be even more impacts,” Liu says. BMPs include structural ones such as dams, wetlands, and riparian buffers, as well as nonstructural or management BMPs like irrigation practices, drainage, tillage, and nutrient management.
The project will help farmers and government agencies choose the most effective BMPs and identify critical areas for BMP implementation in the future. Phase one began in 2004 with funding from Agriculture and Agri-Food Canada (AAFC) and Ducks Unlimited Canada. It also involved many other federal, provincial, municipal, academic, and non-governmental organizations. Phase one ended in 2008, and phase two began in 2009.
“This watershed was chosen because it has a typical prairie environment and a long historical record,” Liu says. “Also, farmers have experimented with various BMPs here, and they’re very collaborative.” In addition, data about the hydrology and economics of the watershed were readily available.
The 18,000-acre STC watershed is flat and dry. Seventy-one percent is under cultivation, with wheat, canola, flax, barley, and oats being the major crops.
The climate is very cold, and frozen soil is a big problem, Liu says, especially when the topsoil is saturated. “When soil is very dry, there is still infiltration into the soil even though the soil is frozen. If the topsoil is saturated and frozen, there will be no infiltration. All snowmelt becomes surface runoff. It has a very high effect on hydrological processes. In Canada, you have to account for this.”
Two groups have been gathering very detailed biophysical and economics data in the 509-acre Steppler watershed, which is within the larger STC watershed. They are conducting field tests-monitoring water quality, nutrient loading, and sedimentation in waterways-and collecting social and economic data from farmers, including crop management and the economic costs of the BMPs.
The Guelph group is using the data collected in the Steppler watershed to develop an integrated hydrologic and economic model to estimate the benefits and costs of the BMPs for the entire STC watershed. One of the challenges in the project was scaling up the data gathered at the farm level so researchers could use it with the hydrologic data from the watershed level, Liu says.
Both the hydrologic and economic data are necessary because there are always economic and environmental tradeoffs when it comes to BMPs.
“By integrating hydrology and economics in the study, we can calculate the cost-benefit ratios,” Liu says. This integrated model allows policy and program designers to evaluate a variety of options regarding BMP implementation.
The economic model estimates the costs of the BMPs to farmers, such as lost income and the cost of implementing them. “If farmers apply BMPs, they can reduce pollutants and improve water quality,” he says. “They may get less income, but the government can invest in them in some way, such as by providing financial incentives.”
The group chose the USDA-developed soil and water assessment tool (SWAT) to create the integrated model because it allowed input of a large number of factors, including crop rotation, tillage operations, planting and harvesting dates, and fertilizer and pesticide application rates, as well as precipitation, temperature, soil type, and characteristics of the slopes.
According to the US Department of Agriculture, SWAT can predict the impact of land management practices on water, sediment, and agricultural chemical yields in watersheds with varying soils, land use, and management conditions over long periods of time.
The modelers adapted SWAT to create a historic model of the STC watershed to show the water quality under baseline conditions. Much of the data came from AAFC, beginning in the 1990s. Although farmers were using BMPs before then, there were only two hydrology stations run by Environment Canada in the watershed to measure them. By 2004, when the project began, there were stations at 17 sites.
“Initially there were only five BMPs to evaluate,” Liu says. These were small dams, manure holding ponds, no-till farming, forage conversion (converting land used for growing wheat to land used for forage), and riparian management (building fencing to keep cows out of the streams and rotating the areas where they were allowed to graze).
The SWAT model doesn’t provide functions for every kind of BMP, and this was another challenge: There is no one model that contains all the functions needed, and often Liu had to painstakingly create them.
“I needed to build modules for some specific BMPs and put them back into the slot,” he says. These new modules will be available to others who work on similar projects. “We have a lot of contact with colleagues. We exchange information regularly at conferences and in articles.”
One of the advantages of the SWAT model is that it is based on the three key factors in controlling runoff and water quality: land use, topography, and soil type. Land use is important because runoff is different depending on the use. Although SWAT provides functions for forests, wetlands, and agricultural and urban areas, it doesn’t simulate the processes of riparian buffers, which also play an important role.
Liu integrated SWAT with another model from the USDA, Riparian Ecosystem Management Model (REMM), which is specifically designed to simulate riparian buffers. He used REMM to evaluate current buffers as well as to design future scenarios to determine such factors as the best location to construct a buffer and the best vegetation to plant.
The results of phase one suggest that the BMPs have led to a reduction in sediment and nutrient loading. Phase two, which began in 2009, includes additional BMPs such as winter bale grazing. This involves farmers letting their cows graze on bales of feed in a series of sections of the fields in the winter; the cows trample the manure, spreading it evenly throughout the fields, and the manure stays out of the waterways.
This integrated hydrologic and economic model can do much more than evaluate BMPs within a time frame, though. It can be applied to other watersheds in similar environments and also can create future scenarios for in this watershed-for example, building small dams or riparian buffers, changing the dates for planting or fertilizing, or changing land use. The model will calculate the resulting differences in the amount of runoff, sediment, and nutrient loading as well as the costs of each BMP.
Lake Michigan Bluffs
Erosion is a continuous process; what better way could there be to display it than with 3D animation on a web site?
As a graduate student working on his master’s degree in GIS at the University of Wisconsin-Madison, Jeff Stone worked on a project to visualize information about the cycle of erosion of the bluffs adjacent to Concordia University, on Lake Michigan. The main goal was to present the information in a way that was scientifically sound, but still interesting to the public.
The project “morphed into animation,” Stone says. It used remote sensing, GIS, cartography, visualization, and 3D CGI (computer-generated imagery), and resulted in a remarkable simulation of the erosion of the bluffs between 1956 and 2000.
Stone used a variety of products from Esri, which develops GIS software, for the mapping, and Visual Nature Studio (VNS) by 3D Nature for the animation. He used Adobe’s Flash to present all the information on a website.
Every bluff has its own “point of failure,” and for bluffs in this area, failure may occur in slopes steeper than approximately 22 degrees. Because of the cohesiveness of the clay, though, while the slopes can be steeper than 22 degrees, they’re also prone to large, infrequent, or episodic slumps. In addition, the root systems of the vegetation don’t penetrate deeply enough to hold the bluffs in place, and saturated soils may be heavy enough to lead to bluff failure.
Stone spent two years between 2003 to 2006 researching, studying, and working on the web site. Funding and support came from the Institute for the Application of Geospatial Technology at Cayuga Community College in Auburn, NY; the University of Wisconsin Sea Grant Institute through the Land Information and Computer Graphics Facility; and the Wisconsin State Cartographer’s Office.
A number of others collaborated on the project, including Dr. David Hart of the university’s Sea Grant Institute, who was Stone’s advisor, and Dr. David Mickelson, professor emeritus of geology. “I put together the concepts and the web site with a lot of help from both these experts,” he says.
The research and work was submitted to be part of a forthcoming book edited by Dr. Marguerite Madden at the University of Georgia-Athens.
Stone used Mickelson’s six phases of bluff failure and erosion for both the mapping and the 3D animation. One page of the website, http://www.geography.wisc.edu/coastal/viz3d/index.html, shows the six phases. Phase one shows a bluff with an unstable slope angle and a high likelihood of failure. Phase two shows a slump. In phase three, waves hit the toe of the bluff, because of either high lake levels or large storms, and remove tons of slumped sediment, which steepens the bluff.
Wave erosion continues to steepen the lower bluff through phase four until, at phase five, the bluffs would continue to fail even if the wave action stopped. Phase six shows that the toe of the bluff has receded much faster than the top. The slope is again unstable and more prone to failing in the near future.
Between 1956 and 2000, the tops of the bluffs receded some 50 feet while the toes receded up to 106 feet in some areas of the study. This process resulted in the slope angle changing from approximately 17 degrees to approximately 24 degrees.
“The bluffs are continually changing,” Stone says. But typically there’s a lag period for erosion between the toe and the top, and each cycle can take decades to complete. The public often sees the bluff as being stable because nothing happens for years-and then, in a matter of minutes or hours, one large slump fails in the equivalent of 50 years of erosion.
“It’s important to show people that this is a continuous process,” he says. “Even if you armor the shoreline, if it’s unstable, it will still settle.”
The population in this area as well as in other coastal areas of the country is increasing, and land use is affecting erosion rates. This includes the removal of vegetation; the construction of buildings, impervious surfaces, and drainage and septic systems on the bluff tops; and shore protection structures at the bases.
Local counties already have building setbacks as part of their zoning ordinances, Stone says, but the setback calculations generally vary from county to county. Another page of the web site shows how stable slope angles and building setbacks can be calculated scientifically. This stable slope approach uses the height and composition of a bluff, historic recession rates, and the expected lifetime of buildings to determine the location of setbacks and can be used as a standardized method in other coastal areas as well.
Stone used Esri’s ArcGIS Desktop Suite, including the Spatial Analyst, 3D Analyst, and Geostatistical Analyst extensions, which allows data and maps to be created, modeled, analyzed, and used on a desktop, in a browser, or in the field. “I’d worked with Esri software for over 20 years,” he says. “ArcGIS has the tools needed to work with and develop the elevation datasets so that they work well with 3D animation.”
One of the main challenges in the project was that the data he needed to recreate the erosion process had never been collected on a regular basis. He began by “data mining” from as many sources as possible. He used satellite images and aerial photos that had been collected at various times, as well as existing topographical and bathymetric data, which included both LiDAR- and sonar-derived data for the lake floor. Unfortunately, even the GIS data weren’t standardized. It was a very time-consuming process to make all the formats compatible.
Another challenge was that he needed some data that didn’t exist at all. Two examples of nonexistent data were a land cover dataset and a historic digital elevation model (DEM). Although the National Oceanic and Atmospheric Administration (NOAA) now has the Coastal Change Analysis Program (C-CAP) for the US, http://www.csc.noaa.gov/digitalcoast, which includes land cover classification, at the time no land cover features were mapped for the study area. The creation of the historic DEM data required using a mapping process based on current elevation data and working back in time.
The second step was to create a historic elevation model. One source of information went back to 1956 and became the benchmark for the project. It included orthophotos taken that year by the US Department of Agriculture. These are aerial photographs that have been adjusted for topographic relief, lens distortion, and camera tilt. They can be used to measure true distance, and they provided an accurate base to delineate the bluff top and toe locations.
He extended the year-2000 bluff top and toe elevation values out to the locations shown on the 1956 orthophotos, and extended the lake-bottom data through the near-shore zone to recreate the lake levels. To simulate the erosion process, he divided the years between 1956 and 2000 into 22 time periods. He manually created contour lines based on erosion patterns in the bluffs for each of 22 time periods, generated elevation models from each contour dataset, and then calculated the difference between them in each time period.
“That took a lot of time as well,” he says.
The animation, or visualization web page, lets viewers watch 44 years of erosion taking place on a half-mile section of the bluff just south of the university in less than a minute.
“Animation is mapping time with time,” he says. He emphasizes that it is a simulation, because so much of the data had to be created.
The ArcGIS 3D Analyst extension was used to export the data to 3D Nature’s VNS. VNS imports or creates entire ecosystems and landscapes and can export them to popular video formats. It’s easy to create scenes that show structures that are built, removed, and replaced; vegetation growing; and realistic roads and highways.
“You can modify the growth of a tree over a 44-year period,” Stone notes.
He used Adobe’s Flash to synchronize all the components and the interaction between the text, graphics, and animated displays into the very easy-to-use website. The visualization exhibit has been presented at several professional and public forums, such as the Rotary Club and the county’s Citizen Advisory Committee.
“After seeing it, people quickly start seeing that houses may be falling into the lake if they’re not moved,” he says.
The purpose of the project isn’t to predict bluff failure, though. It’s to demonstrate that there are major losses of bluffs due to erosion over several decades. He’d like to see a visualization of how other scenarios might play out in the future, such as the results of removing vegetation or an underground sewer tank, or changing shore structures such as sea walls and riprap to show how sediment transport is affected.
“The project was tedious at times, but it was fun,” he says, “and it’s starting to tie into a lot of other projects. I have projects with NOAA that seek to educate the public and local policy-makers about coastal resilience and adaptation to issues such as sea level rise.”