Guest Editorial: ”R”–A Free Solution for Statistics and Graphing
Statistical software can be expensive: A single-license JMP costs $1,470, SAS/ACCESS $3,000, and SAS Analytics Pro more than $8,000. Furthermore, it can be difficult to learn how to use new software and keep up with upgrades. It is not uncommon for expensive programs to be left relatively unused because so few people know how to use them. In our increasingly data-driven world, finding a cost-effective way to complete analyses and graph data can be a challenge.
Within the academic realm, there is ever-increasing interest in using open-source program “R.” R (R Core Team 2014) is an object language and environment for free statistical and graphical computing with Windows, UNIX, and MacOS. It is a free, powerful, and widely used and accepted software for analysis. Furthermore, R is easily expanded via packages, which do most of the programming for you. Eight packages are supplied with R download, with many more available for free online that cover a wide range of statistical tests and graphing options.
Resources to Get You Started
Though R may have a steep learning curve due to its code-driven nature, there are many resources available to help new users get their bearings. Drs. Roger Peng, Jeff Leek, and Brian Caffo of Johns Hopkins offer free online courses in R through Coursera several times
per year.
In addition, there are numerous books and online support (aside from the documentation within R itself) for those who are interested in using R but do not know where to start. In particular, Mark Gardener’s Statistics for Ecologists Using R and Excel gives beginning users step-by-step directions to perform basic statistics in both Excel and R. The R Book by Michael J. Crawley is a complete guide to coding and graphics that could prove useful to even those with quite a bit of experience using R. There are also many great websites including—but not limited to—Cookbook for R and Quick R: Accessing the Power of R. There is even an R package called swirl (Carchedi et al. 2014), which teaches programming and data analysis interactively within the R console. (See http://swirlstats.com for more details.) Finally, there are a large number of Internet forums where people can post questions or issues and receive help.
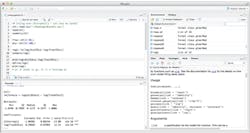
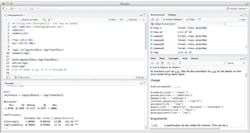
If you make the switch to R, I highly recommend installing RStudio as your interface for R. RStudio is a free software that is used to make R a bit more user friendly by implementing drop-down menus, data import options, and color coding for easier error detection (Figure 1).
Basic Example
Although R can be used for almost any analysis or graph, I have often used it to visualize data and complete basic statistics tests. For example, to compare baseflow versus stormflow bacteria concentrations in a river, I completed the following steps in R:
- uploaded my data as a .csv file,
- transformed the bacteria concentrations so each was the log of the original value,
- averaged each site’s baseflow and stormflow bacteria concentrations,
- used the log-values in a t-test to see if baseflow and stormflow concentrations varied significantly at each site, and
- graphed the data on a log scale with boxplots in a site order I specified.
Each of these steps is saved in a script file, so even many months later I could come back and run the exact same analysis. Once you have the base script, tweaks and alterations are easy to implement.
Conclusions
Businesses, consulting firms, and governmental organizations should strongly consider using R for statistics and building graphics. Not only is it free and continuously updated, but the open-source nature of R makes it incredibly versatile for a wide array of applications. Although the code-driven format can seem daunting initially, there are many resources to guide you. Take the time to explore R, and see how it might be able to work for you.
Resources
Carchedi, N., B. Bauer, G. Grdina, and S. Kross. 2014. swirl: Learn R, in R. R package version 2.2.15. http://cran.r-project.org/package=swirl
Chambers, J. 2008. Software for Data Analysis: Programming With R. Springer.
Chang, W. Cookbook for R. www.cookbook-r.com.
Crawley, M. J. 2012. The R Book. John Wiley & Sons.
Gardener, M. 2012. Statistics for Ecologists Using R and Excel: Data Collection, Exploration, Analysis and Presentation. Pelagic Pub.
Kabacoff, R. 2014. Quick R: Accessing the Power of R. www.statmethods.net.
R Core Team. 2014. R: A Language and Environment for Statistical Computing. R Foundation for Statistical Computing, Vienna, Austria. www.r-project.org.
RStudio. 2014. RStudio: Integrated Development Environment for R (Version 0.98.501). RStudio, Boston, MA. www.rstudio.org.
R Product downloads, FAQs, and manuals. www.r-project.org.
Short, T. 2004. R Reference Card. http://cran.r-project.org/doc/contrib/Short-refcard.pdf.
Venables, W., and B. D. Ripley. 2000. S Programming. Springer.

